Title: Likelihood that this will be the map
Post by: The Mikado on April 29, 2012, 07:30:54 PM
( )
)
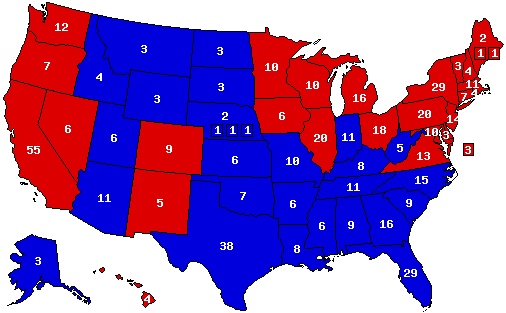
Obama 285, Romney 253. No percentages. Discuss.
Obama 285, Romney 253. No percentages. Discuss.
Title: Re: Likelihood that this will be the map
Post by: Negusa Nagast 🚀 on April 29, 2012, 07:32:41 PM
This is Obama 303, Romney 235.
This is probably the modest Obama win. UE stays the same/slightly down and GDP growth hovers at 1.5-2%.
This is probably the modest Obama win. UE stays the same/slightly down and GDP growth hovers at 1.5-2%.
Title: Re: Likelihood that this will be the map
Post by: MASHED POTATOES. VOTE! on April 29, 2012, 07:33:34 PM
Possibly. This election is going to be closer than many people think, but I don't see Obama losing NC in such scenario.
Title: Re: Likelihood that this will be the map
Post by: Undisguised Sockpuppet on April 29, 2012, 07:38:31 PM
If Romney's campaign is limp and the economy continues to slowly chug along without major troubles that map would be a reasonable guess. The only things I'd change would be marking most states with the 40% shade.
Of course, this raises the question: What are the likely shifts in congress with a narrow dem win?
Of course, this raises the question: What are the likely shifts in congress with a narrow dem win?
Title: Re: Likelihood that this will be the map
Post by: Adam Griffin on April 29, 2012, 07:40:08 PM
This map is the floor for Obama at this point. I think it's very likely considering that Romney may be able to win places like MO, IN, NC, and FL but will have to make considerable improvements in his image and platform in order to win any of the Obama states on the map.
Title: Re: Likelihood that this will be the map
Post by: 🐒Gods of Prosperity🔱🐲💸 on April 29, 2012, 07:52:02 PM
likely. this is my current prediction except for NH.
Title: Re: Likelihood that this will be the map
Post by: TomC on April 29, 2012, 08:48:32 PM
I'm getting iffy on Virginia, otherwise looks good.
Title: Re: Likelihood that this will be the map
Post by: old timey villain on April 29, 2012, 09:07:54 PM
Possibly. This election is going to be closer than many people think, but I don't see Obama losing NC in such scenario.
I've been hearing people constantly say that this election will be very close, which is certainly possible. But here's my issue with that: Since 1916, only two patterns have existed with incumbent presidents running for reelection. They either win a second term by a larger popular and electoral vote margin, or they lose big against their challenger. It seems to be a pretty consistent pattern over the past century, which leads me to believe that one or the other will happen this year. Obama wins big or he loses big.
Title: Re: Likelihood that this will be the map
Post by: old timey villain on April 29, 2012, 09:30:58 PM
Hate to bring in a bunch of statistics but I feel like I need to back up my point. Here are the popular vote margins of victory or defeat for presidents running for two terms since 1912:
Wilson
1912: 14 point victory
1916: 3 point victory (Wilson won in a 3 man race in 1912. 1916 brought the country back to the typical two man contest in an era that favored Republicans)
Hoover
1928: 18 points
1932: -18 points
a 36 point swing!
Roosevelt
1932: 18 points
1936: 24 points
(Yes, Roosevelt ran two more times, and yes he won by less. This theory that I have probably wouldn't be a thing if presidents could still serve more than 2 times. For instance, Reagan might have won in 1988 but by a smaller margin)
Eisenhower
1952: 11 points
1956: 15 points
Nixon
1968: 1 point
1972: 23 points
Carter
1976: 2 points
1980: -10 points
Reagan
1980: 10 points
1984: 18 points
Bush
1988: 8 points
1992: -6 points
Clinton
1992: 6 points
1996: 9 points
Bush
2000: -.5 points
2004: 3 points
So, as you can see, since 1916, the pattern has been pretty consistent. I think it has a lot to do with the incumbency factor, which can be a huge bonus for presidents or a huge liability. When a president is running for reelection during good times, he can take credit for this, convincing many voters to cast their ballot for him, even if they weren't too sure four years earlier.
When things are bad, the nation's problems hang over his neck like an albatross, which will usually depress his base and convince millions of swing voters to cast their ballot for somebody else.
Things aren't too great right now, but they're not as terrible as they used to be either. If we continue on the path of moderate economic growth and a continuing lull on the world stage, I think Obama will keep his base and convince a lot of the same swing voters to stick with him, provided he has a good message, which will help him to do slightly better than in 2008.
But before you call me a hack, I also believe that if the economy moves in the opposite direction, like a double dip, or if Obama's wars heat back up, then I think he will lose spectacularly. We may not see it in the polls, but it will be made clear on election day that Romney won over a majority of Obama's swing voters. The same thing happened during 1980. People kept saying it would be close, but we all know how that one turned out.
Title: Re: Likelihood that this will be the map
Post by: tpfkaw on April 29, 2012, 09:37:35 PM
You also forgot Truman and Johnson, who were unpopular enough that they were defeated for renomination.
Title: Re: Likelihood that this will be the map
Post by: old timey villain on April 29, 2012, 09:40:24 PM
You also forgot Truman and Johnson, who were unpopular enough that they were defeated for renomination.
good point. I only listed presidents who ran again, but if Johnson and Truman had managed to win the nomination, they probably would have done worse that the actual Dem nominees that year. Ironically, in 1952 and 1968, the US economy was doing very well, but they were both done in by two very unpopular wars.
Title: Re: Likelihood that this will be the map
Post by: ag on April 29, 2012, 10:08:23 PM
To the best of my knowledge, Truman never really planned to run for nomination in 1952. It was his firm view that 2 terms was enough - and he had almost complete 2 terms in office. He did held off announcing it long past the decision - obviously, it helps not being perceived as a lame duck. But he never planned to run. Had he tried, I'd hate to discard him - he had won in 1948 against, probably, worse odds, hadn't he?
Title: Re: Likelihood that this will be the map
Post by: tpfkaw on April 29, 2012, 10:12:31 PM
To the best of my knowledge, Truman never really planned to run for nomination in 1952. It was his firm view that 2 terms was enough - and he had almost complete 2 terms in office. He did held off announcing it long past the decision - obviously, it helps not being perceived as a lame duck. But he never planned to run. Had he tried, I'd hate to discard him - he had won in 1948 against, probably, worse odds, hadn't he?
According to Gallup polling, Truman was the most unpopular president ever by 1952 (yes, worse than Nixon). If he ran again and was somehow renominated, there's a good chance he wouldn't have won a single state.
Title: Re: Likelihood that this will be the map
Post by: old timey villain on April 29, 2012, 10:20:45 PM
To the best of my knowledge, Truman never really planned to run for nomination in 1952. It was his firm view that 2 terms was enough - and he had almost complete 2 terms in office. He did held off announcing it long past the decision - obviously, it helps not being perceived as a lame duck. But he never planned to run. Had he tried, I'd hate to discard him - he had won in 1948 against, probably, worse odds, hadn't he?
1948 was certainly a huge upset, but I think the anticipated results has more to do with what the media was reporting than what the people wanted. I think after 16 years of democratic rule, the press really was rooting for Dewey and tried to create a self fulfilling prophecy, as evidenced by the "Dewey defeats Truman" headline printed before the results were even counted. But in 1948, Truman enjoyed a surge of popularity due to an economic recovery, the popular Berlin airlift, and a very unpopular Republican congress. So the public mood wasn't nearly as negative by fall of 1948 as it had been earlier.
Title: Re: Likelihood that this will be the map
Post by: True Federalist (진정한 연방 주의자) on April 29, 2012, 10:23:20 PM
I've been hearing people constantly say that this election will be very close, which is certainly possible. But here's my issue with that: Since 1916, only two patterns have existed with incumbent presidents running for reelection. They either win a second term by a larger popular and electoral vote margin, or they lose big against their challenger. It seems to be a pretty consistent pattern over the past century, which leads me to believe that one or the other will happen this year. Obama wins big or he loses big.
1924, 1948, 1980, 1992, and 1996 are distorted by the presence of a significant third party campaign. 1936 and 1956 were but slight improvements for the incumbent on their blowout of four years previous. 1964, 1972, and 1984 each had message candidates nominated as opponents who were not near the political center. 1932 had the shock of The Great Depression to cause a massive change in the electorate. The only incumbent election since 1916 that was roughly similar was 2004, in which the incumbent improved slightly over his results of four years earlier. Romney is not a message candidate, so absent some major new shock, there is no reason to expect a major change from 2008.
Title: Re: Likelihood that this will be the map
Post by: old timey villain on April 29, 2012, 10:34:56 PM
I've been hearing people constantly say that this election will be very close, which is certainly possible. But here's my issue with that: Since 1916, only two patterns have existed with incumbent presidents running for reelection. They either win a second term by a larger popular and electoral vote margin, or they lose big against their challenger. It seems to be a pretty consistent pattern over the past century, which leads me to believe that one or the other will happen this year. Obama wins big or he loses big.
1924, 1948, 1980, 1992, and 1996 are distorted by the presence of a significant third party campaign. 1936 and 1956 were but slight improvements for the incumbent on their blowout of four years previous. 1964, 1972, and 1984 each had message candidates nominated as opponents who were not near the political center. 1932 had the shock of The Great Depression to cause a massive change in the electorate. The only incumbent election since 1916 that was roughly similar was 2004, in which the incumbent improved slightly over his results of four years earlier. Romney is not a message candidate, so absent some major new shock, there is no reason to expect a major change from 2008.
And I agree. if we continue on the same path, Obama wins by a similar margin as in 2008, but possibly by slightly more, like a point or two, based solely on incumbency. Romney does not represent a drastically different nominee for the Republicans who could swing large portions of the electorate, a la Clinton in 1992. And Romney doesn't have a compelling, major issue to run on either, like Roosevelt in 1932 (economy) or Reagan in 1980 (hostage/economy/inflation). So I expect similar results with Obama continuing to improve in the areas that swung greatly towards him in 2008.
I also found this Gallup chart of Truman's approval ratings.
()
Truman's approval rating shoots upward in the second half of 1948. So based solely on approval ratings, Truman's win was not unexpected.
Title: Re: Likelihood that this will be the map
Post by: True Federalist (진정한 연방 주의자) on April 29, 2012, 11:11:57 PM
I also found this Gallup chart of Truman's approval ratings.
()
Truman's approval rating shoots upward in the second half of 1948. So based solely on approval ratings, Truman's win was not unexpected.
()
Truman's approval rating shoots upward in the second half of 1948. So based solely on approval ratings, Truman's win was not unexpected.
Yes it was unexpected. That was back in the day before they did so many polls. The reason why the graph is so smooth for the second half of 1948 was that Gallup did no popularity polls in that period. So Truman went from 40% in the June 1948 poll to 69% in the January 1949 poll. In November 1948 people did not have a January 1949 poll to interpolate a 60% approval rating as you are assuming.
Title: Re: Likelihood that this will be the map
Post by: old timey villain on April 29, 2012, 11:30:40 PM
I also found this Gallup chart of Truman's approval ratings.
()
Truman's approval rating shoots upward in the second half of 1948. So based solely on approval ratings, Truman's win was not unexpected.
()
Truman's approval rating shoots upward in the second half of 1948. So based solely on approval ratings, Truman's win was not unexpected.
Yes it was unexpected. That was back in the day before they did so many polls. The reason why the graph is so smooth for the second half of 1948 was that Gallup did no popularity polls in that period. So Truman went from 40% in the June 1948 poll to 69% in the January 1949 poll. In November 1948 people did not have a January 1949 poll to interpolate a 60% approval rating as you are assuming.
Yes, you are correct in your statement. Polling wasn't the industry back then that it is today. And no, I'm not assuming that Truman's approval rating was 60% on election day, as a 60% approval rating would have translated into a landslide. My original point is that Truman's 30 point rise in approval (from 40% in June to 70% in January of 49) did not occur in a vacuum. Things began to move in Truman's favor in the second half of 1948 and his approval rating obviously increased, enough to win reelection.
So Truman's victory was surprising when you consider how he was treated as the underdog in the press, but obviously the press got it wrong. They didn't catch the turn in Truman's fortunes as they were convinced that Dewey would win no matter what. Therefore, Truman campaigned harder and Dewey got lazy.
Title: Re: Likelihood that this will be the map
Post by: ag on April 30, 2012, 12:59:52 AM
In 1948 there was a three-way split of the Dem party. Would there still be one in 1952 were Truman to be nominated? Also, arguably, he'd think more of his own popularity had he been planning to run for office again - those numbers you see in early 1952 (which are not that far below his abysmal numbers in 1948) are, at least in part, endogenous to his decision not to run.
Title: Re: Likelihood that this will be the map
Post by: ucscgaldamez on April 30, 2012, 01:03:42 AM
This country has been very divided since the year 2000. We are in the middle of an ideological struggle that no side is winning. I feel that the 2012 election is the continuation of how divided this country has been since the year 2000. And the result will be a very close race. At the end, it's hard to predict what will happen. All I can I say is, I wouldn't be surprised with a 49-49 popular vote or 50-49 either way. No candidate will win by more than 4%. That's my guess.
Title: Re: Likelihood that this will be the map
Post by: Chaddyr23 on April 30, 2012, 01:29:12 AM
This is the map I drew up too
Title: Re: Likelihood that this will be the map
Post by: Erc on April 30, 2012, 11:22:48 AM
I've been hearing people constantly say that this election will be very close, which is certainly possible. But here's my issue with that: Since 1916, only two patterns have existed with incumbent presidents running for reelection. They either win a second term by a larger popular and electoral vote margin, or they lose big against their challenger. It seems to be a pretty consistent pattern over the past century, which leads me to believe that one or the other will happen this year. Obama wins big or he loses big.
1924, 1948, 1980, 1992, and 1996 are distorted by the presence of a significant third party campaign. 1936 and 1956 were but slight improvements for the incumbent on their blowout of four years previous. 1964, 1972, and 1984 each had message candidates nominated as opponents who were not near the political center. 1932 had the shock of The Great Depression to cause a massive change in the electorate. The only incumbent election since 1916 that was roughly similar was 2004, in which the incumbent improved slightly over his results of four years earlier. Romney is not a message candidate, so absent some major new shock, there is no reason to expect a major change from 2008.
Let's not forget that 1980 only turned into a blowout in the last week, after the debate. Had the debate gone differently (or never happened), Carter may well have eked out a narrow victory, Anderson or no Anderson.
And I wouldn't quite put Mondale in the same category as McGovern or Goldwater.
Title: Re: Likelihood that this will be the map
Post by: opebo on April 30, 2012, 11:28:58 AM
Yeah, that map is very likely, perhaps the likeliest of all. Only VA, OH, FL, and NC are really in doubt to my way of thinking.
Title: Re: Likelihood that this will be the map
Post by: Amenhotep Bakari-Sellers on April 30, 2012, 05:33:44 PM
It will come down to NV, CO, and Obama having a shot at NH or OH to clinch to 270 electoral votes needed for victory. If Romney picks another Palin or the economy gets suddenly stronger than the 2.5 annual rate then Obama will get 300.
Title: Re: Likelihood that this will be the map
Post by: BaldEagle1991 on April 30, 2012, 08:43:44 PM
()
Obama 285, Romney 253. No percentages. Discuss.
Obama 285, Romney 253. No percentages. Discuss.
If Romney wins Florida according to your map, then he has a shot.
Title: Re: Likelihood that this will be the map
Post by: Indy Texas on April 30, 2012, 09:26:12 PM
Possibly. This election is going to be closer than many people think, but I don't see Obama losing NC in such scenario.
I've been hearing people constantly say that this election will be very close, which is certainly possible. But here's my issue with that: Since 1916, only two patterns have existed with incumbent presidents running for reelection. They either win a second term by a larger popular and electoral vote margin, or they lose big against their challenger. It seems to be a pretty consistent pattern over the past century, which leads me to believe that one or the other will happen this year. Obama wins big or he loses big.
2004 is the elephant in the room. Bush won by the skin of his teeth. I think this will be a 2004-style election.
Title: Re: Likelihood that this will be the map
Post by: old timey villain on April 30, 2012, 10:02:41 PM
Incumbent presidents have the tendency to either keep their base from their first go around, or lose the base that weakly supported them in the first place. With moderate economic growth and a stable world stage, I see Obama keeping his base. It won't be like 2004. I would say otherwise if Romney represented something new in the party, but he does not.
In 1980 Carter lost the support of white southerners who had been trending Republican for two decades. Reagan was bold enough to win them back despite not being a native son.
Bush won white blue collar Reagan democrats in 1988 by portraying Dukakis as an out of touch wacky liberal. In 1992, when he ran against Bubba, he couldn't convincingly make that claim against Clinton and lost those voters who were essentially on loan to the Republicans anyway.
Does Obama lose many of the wealthy suburban voters against a moderate/suburban friendly Romney? Maybe, but I don't see it.
I know it seems like I'm going beyond the topic at hand, but I don't think you can just make up a map of the swing states from the last 10 years and decide that 2012 will look like that. You have to look up trends and historical patterns as well.
Title: Re: Likelihood that this will be the map
Post by: pbrower2a on May 01, 2012, 08:58:22 AM
I've been hearing people constantly say that this election will be very close, which is certainly possible. But here's my issue with that: Since 1916, only two patterns have existed with incumbent presidents running for reelection. They either win a second term by a larger popular and electoral vote margin, or they lose big against their challenger. It seems to be a pretty consistent pattern over the past century, which leads me to believe that one or the other will happen this year. Obama wins big or he loses big.
1924, 1948, 1980, 1992, and 1996 are distorted by the presence of a significant third party campaign. 1936 and 1956 were but slight improvements for the incumbent on their blowout of four years previous. 1964, 1972, and 1984 each had message candidates nominated as opponents who were not near the political center. 1932 had the shock of The Great Depression to cause a massive change in the electorate. The only incumbent election since 1916 that was roughly similar was 2004, in which the incumbent improved slightly over his results of four years earlier. Romney is not a message candidate, so absent some major new shock, there is no reason to expect a major change from 2008.
Let's not forget that 1980 only turned into a blowout in the last week, after the debate. Had the debate gone differently (or never happened), Carter may well have eked out a narrow victory, Anderson or no Anderson.
And I wouldn't quite put Mondale in the same category as McGovern or Goldwater.
Goldwater and McGovern both dared appeal to the more radical wings of their Parties and got much excitement from them but offended the sensibilities of many not-so-firm members of their Parties. Mondale got recognition from Democrats for long and faithful service to the Party and excited nobody while offending few, so he got more than the 36% floor of partisan support. Mondale simply reminded Americans of the inadequacy of Jimmy Carter as President and didn't have much of a message. Reagan won 49 states but won a raft of them by narrower margins than those by which Nixon and LBJ did.
A "message" candidate loses badly in 2012... which is about what we saw with Newt Gingrich and Sarah Palin.
Title: Re: Likelihood that this will be the map
Post by: angus on May 01, 2012, 11:27:16 AM
I like the map, except that I'd switch Virginia, Florida, and New Hampshire. Manufacturing growth is steady, unemployment rate continues to fall, the DJIA stays above 13000, and Obama wins.
Title: Re: Likelihood that this will be the map
Post by: opebo on May 01, 2012, 12:37:23 PM
I like the map, except that I'd switch Virginia, Florida, and New Hampshire. Manufacturing growth is steady, unemployment rate continues to fall, the DJIA stays above 13000, and Obama wins.
Really, Florida more Democratic than New Hampshire or Virginia? I doubt it.
Title: Re: Likelihood that this will be the map
Post by: angus on May 01, 2012, 12:51:32 PM
I like the map, except that I'd switch Virginia, Florida, and New Hampshire. Manufacturing growth is steady, unemployment rate continues to fall, the DJIA stays above 13000, and Obama wins.
Really, Florida more Democratic than New Hampshire or Virginia? I doubt it.
Virginia swings a bit in recent polling, but in eight of the last ten elections has given its votes to the Republican. I was in Virgina for a couple of days last month, but I didn't get into any conversations about politics with the locals. I'm not sure what in- or out-migration has occurred there since the Credit Crunch of 2008, or what effect it has on the upcoming general election, but it seems easier to call than Florida. New Hampshire will have greater affinity for Romney than for Obama. I'd ignore any polls out of there except the one that matters, which will happen in November.
In any case, I'd generally agree with the map posted, with only those exceptions.
Title: Re: Likelihood that this will be the map
Post by: zorkpolitics on May 01, 2012, 07:58:29 PM
This is a likely Romney's minimum win: 270 to 268:
( )
)
This is a another likely Romney's minimum win: 272 to 266:
( )
)
This is the unlikely but possible Romney blowout: 356 to 182:
( )
)
(
This is a another likely Romney's minimum win: 272 to 266:
(
This is the unlikely but possible Romney blowout: 356 to 182:
(
Title: Re: Likelihood that this will be the map
Post by: opebo on May 01, 2012, 08:34:44 PM
New Hampshire will have greater affinity for Romney than for Obama.
Nah, I think you're thinking of New Hampshire circa 1988 or 1992. Things have changed. Even if Romney does harken back to Daddy Bush days, the GOP isn't New Hampshirites darling anymore. I think they'll come home again to their moderate/liberal home (and the home of all moderate/social liberal former Republicans) - the Democratic Party.
Title: Re: Likelihood that this will be the map
Post by: Zagg on May 01, 2012, 09:09:16 PM
Virginia, Colorado, New Mexico, and Nevada. Looks like a tall order to me.
Title: Re: Likelihood that this will be the map
Post by: old timey villain on May 01, 2012, 09:23:56 PM
New Hampshire will have greater affinity for Romney than for Obama.
Nah, I think you're thinking of New Hampshire circa 1988 or 1992. Things have changed. Even if Romney does harken back to Daddy Bush days, the GOP isn't New Hampshirites darling anymore. I think they'll come home again to their moderate/liberal home (and the home of all moderate/social liberal former Republicans) - the Democratic Party.
And even in 1992 New Hampshire didn't have enough of an affinity for Bush to vote for him again. There was a 25 point swing against Bush in '92, and even with the Perot effect, this is still pretty bad for one of his best states in 1988. It must have been that darn libertarian streak in NH. Reneging on his "no new taxes" pledge probably hurt him terribly up there.
Title: Re: Likelihood that this will be the map
Post by: old timey villain on May 01, 2012, 09:34:11 PM
I get more convinced every day that 1992 was a realigning election. Not one that heralded a vast advantage for the Democratic party, but definitely one that solidified the party's strength in all areas of the northeastern part of the country. 20 years ago, Romney would have been a perfect fit for New England and the suburban mid atlantic. But by 1992, the political "heart" of the GOP had completely shifted from Westchester NY to Waco TX (speaking metaphorically of course). Now, Romney has to play to the new base down south instead of the Yankee Republicans he could probably connect with much more easily. And as a result, the Northeast will still avoid Romney like the plague, even though he is basically a native son.
The GOP really sold their soul for the southern strategy. It helped them achieve incredible victories but eventually boxed them in.
The GOP really sold their soul for the southern strategy. It helped them achieve incredible victories but eventually boxed them in.