Title: Swing and Trend maps for each year
Post by: Nym90 on August 24, 2006, 11:04:33 PM
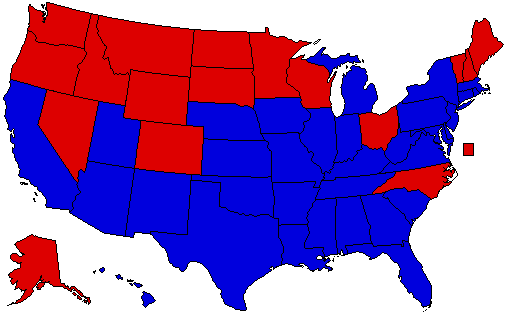
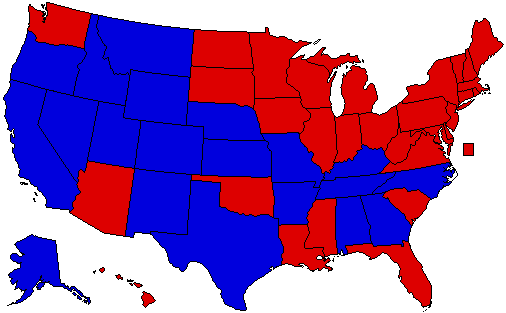
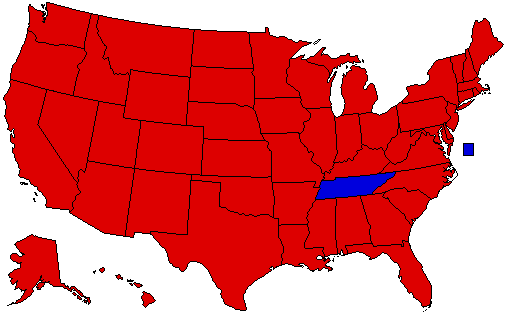
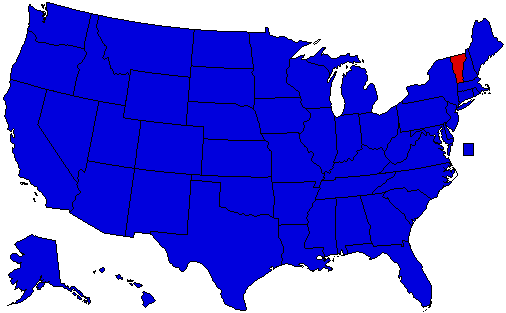
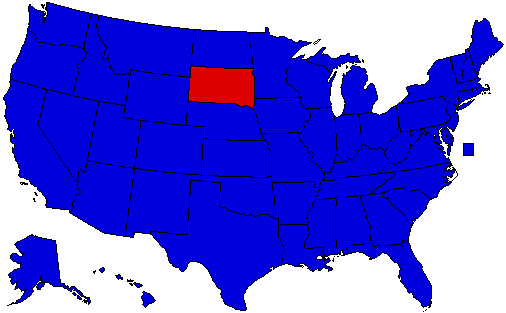
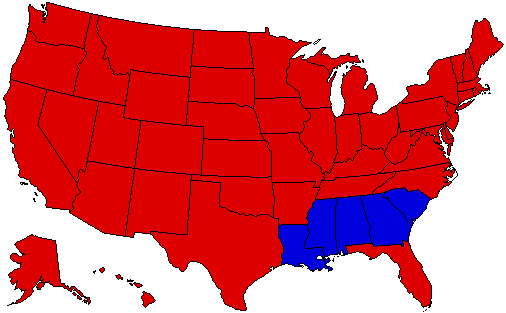
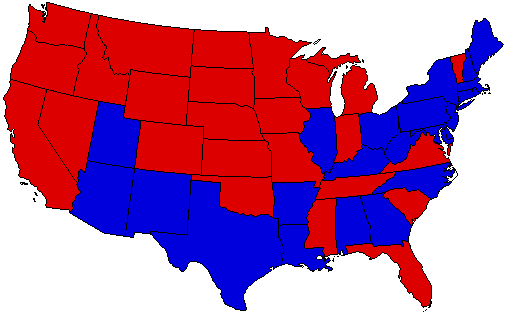
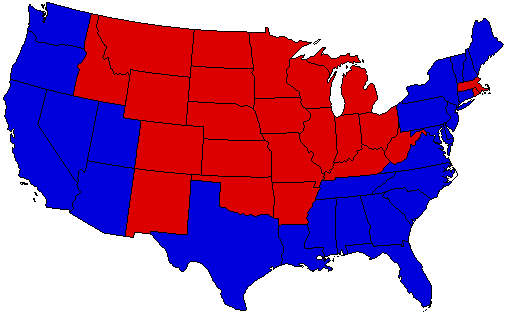
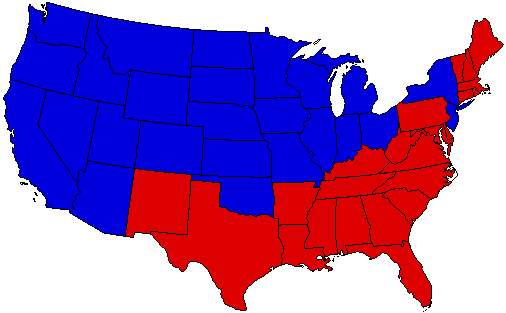
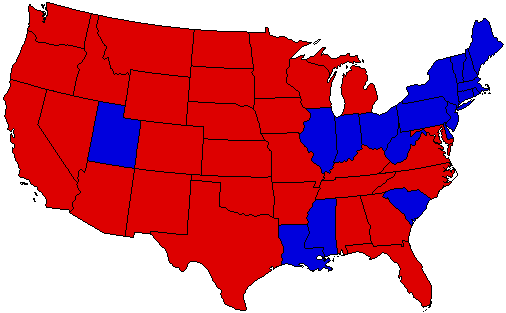
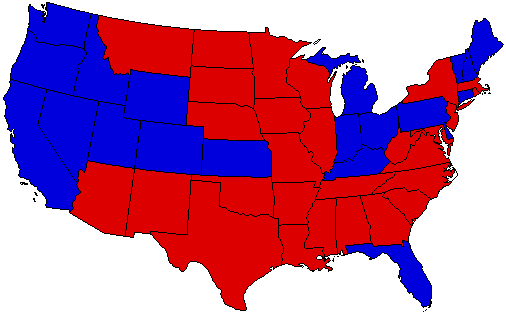
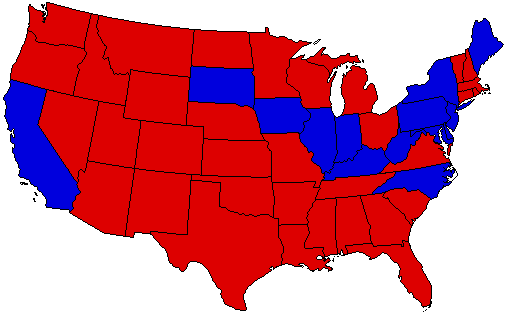
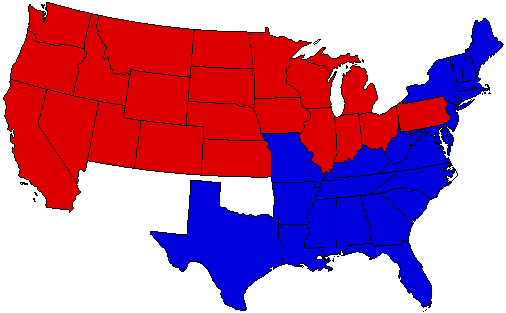
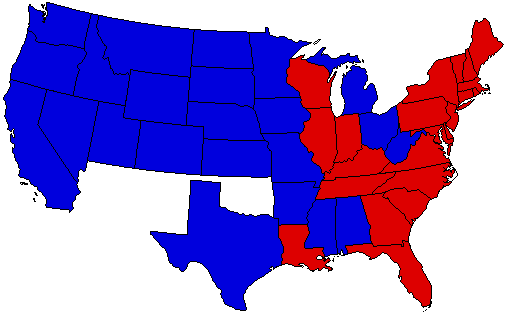
2004 Swing
( )
)
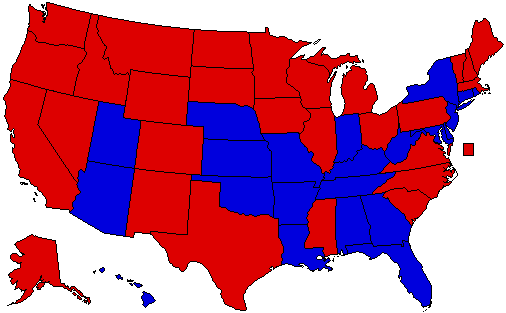
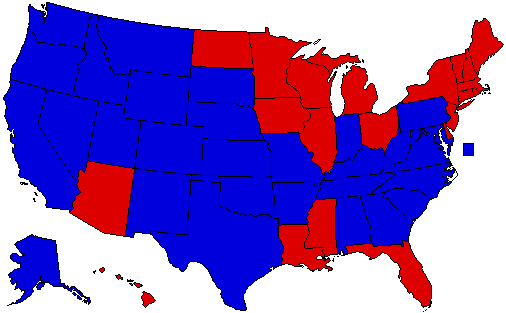
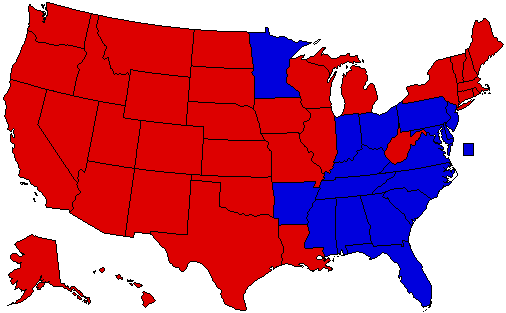
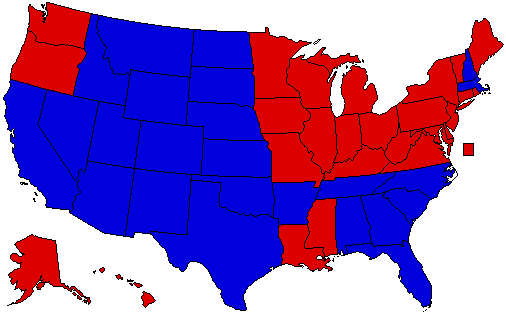
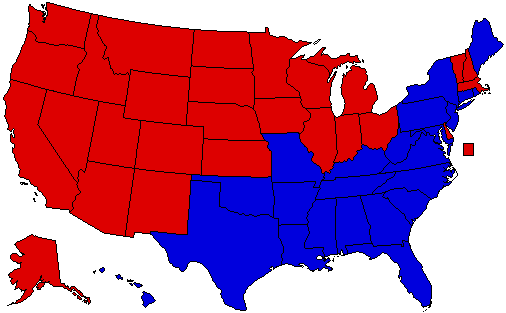
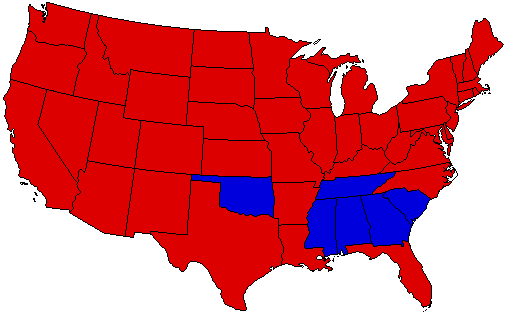
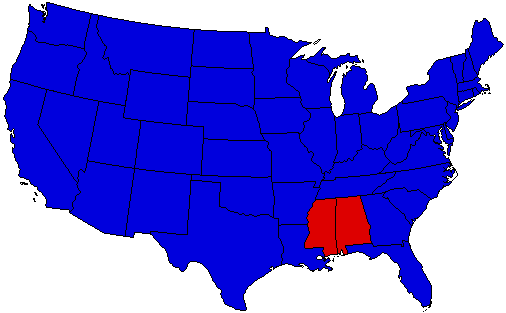
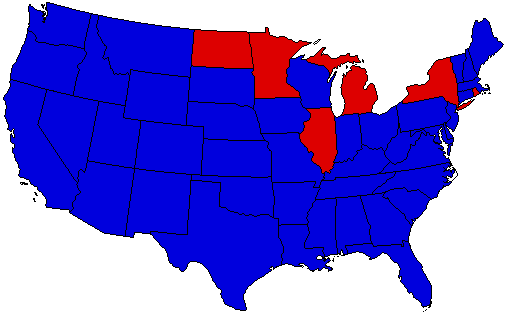
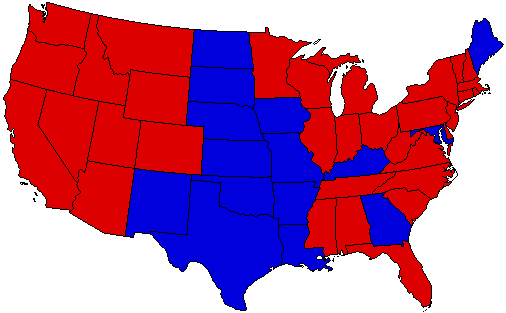
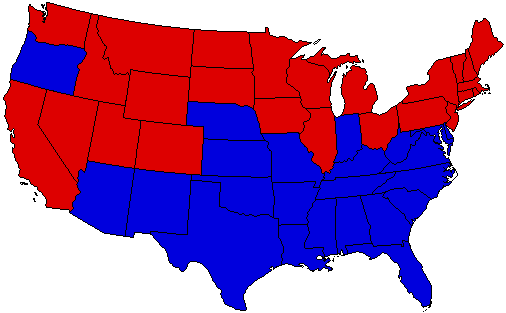
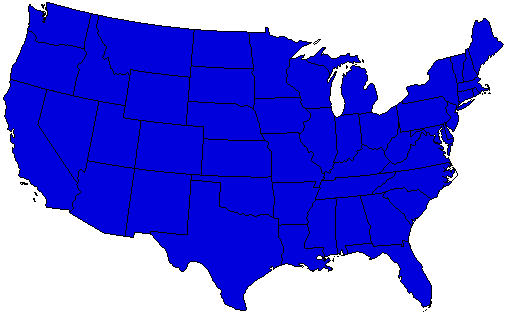
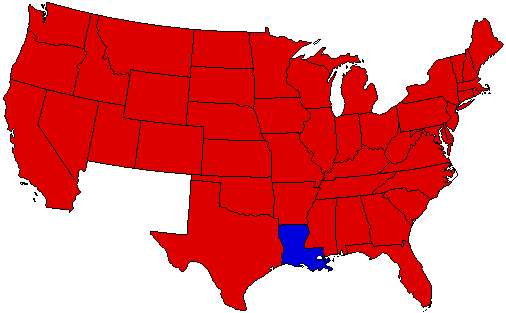
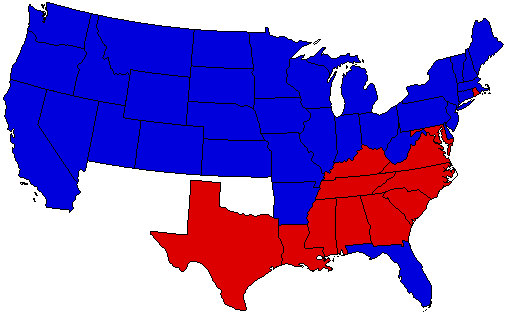
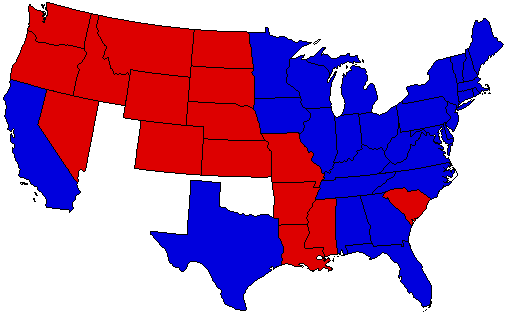
2004 Trend
( )
)
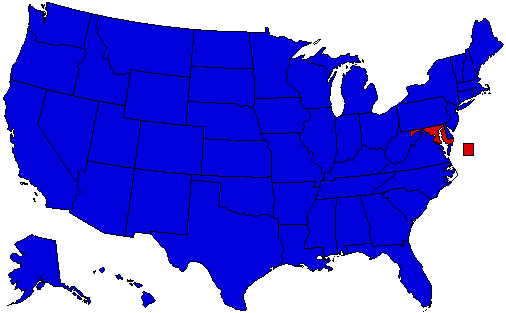
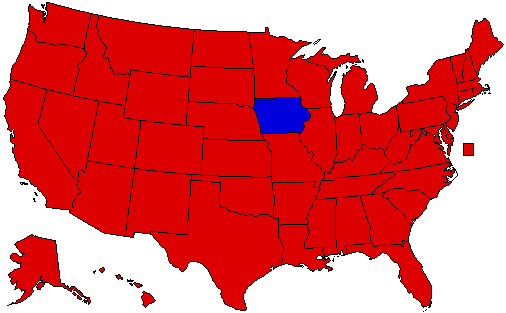
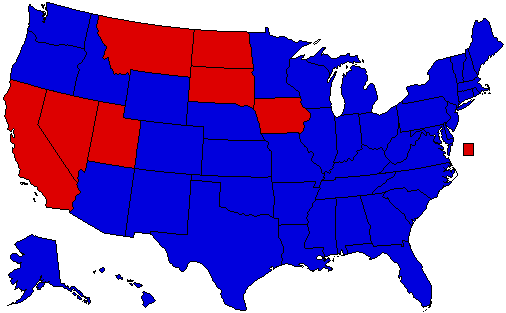
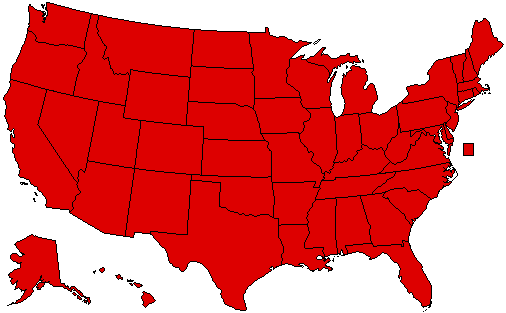
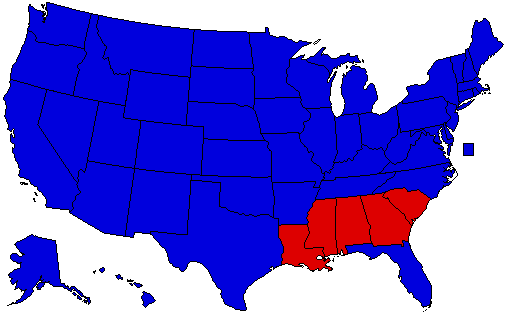
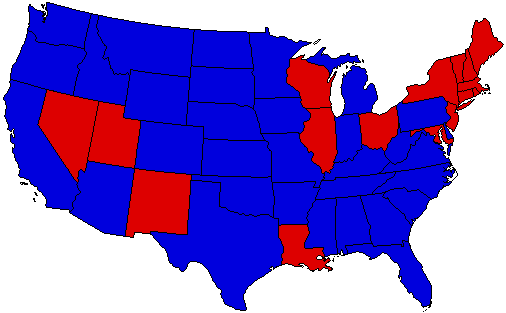
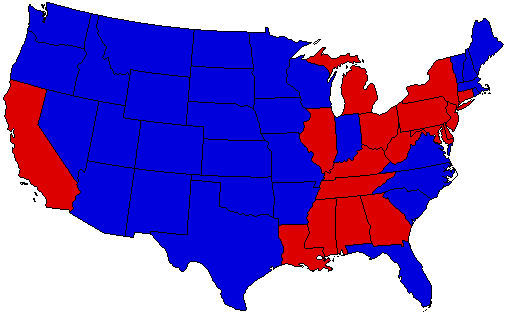
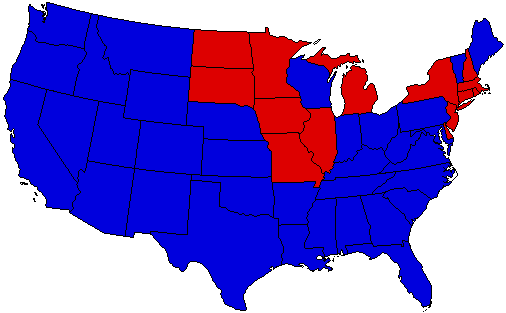
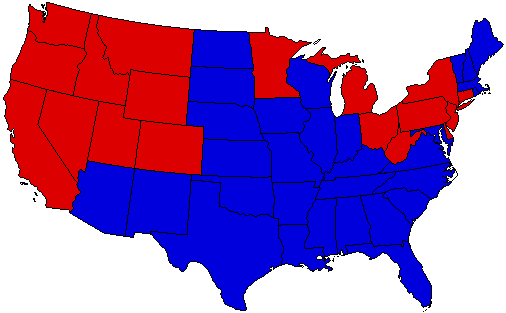
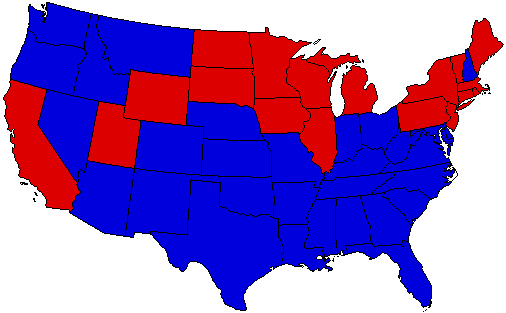
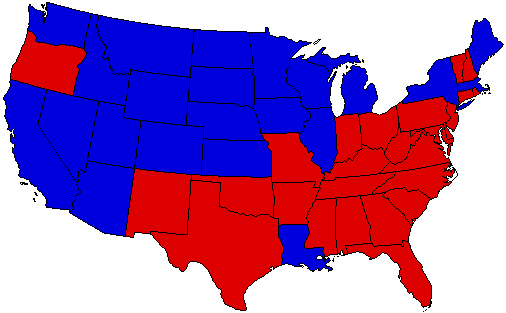
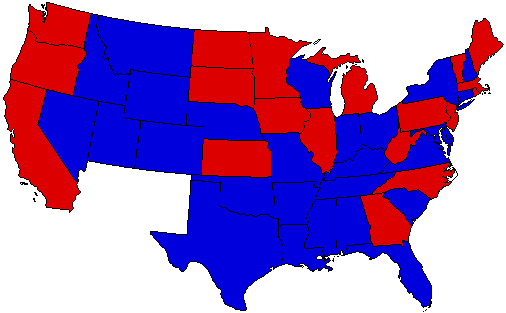
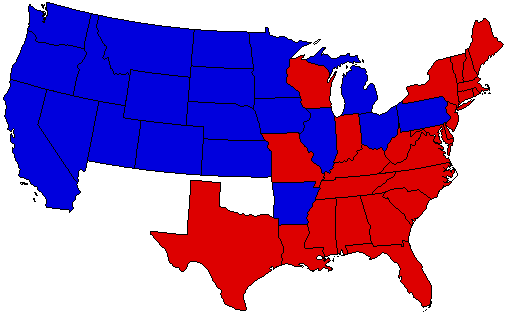
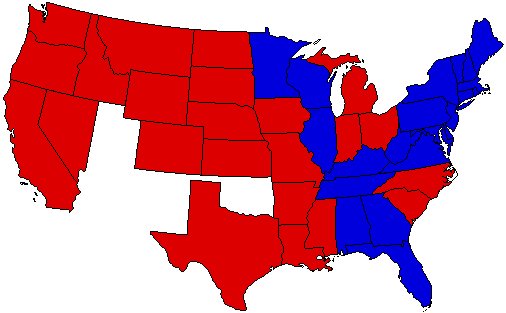
2000 Swing
( )
)
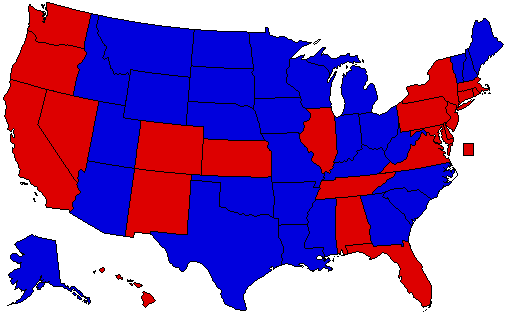
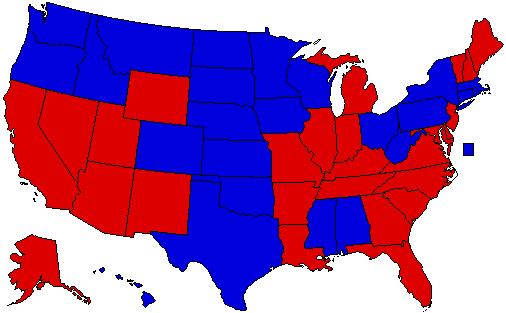
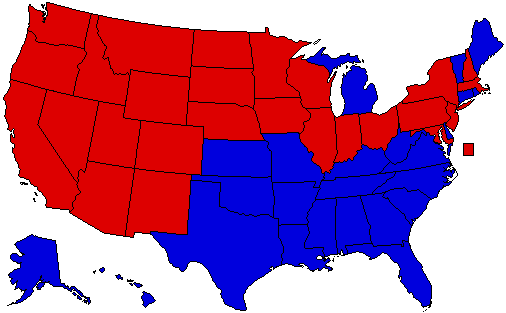
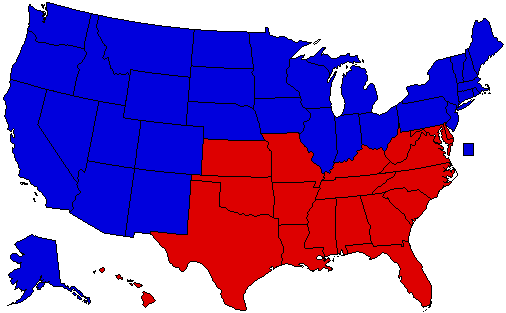
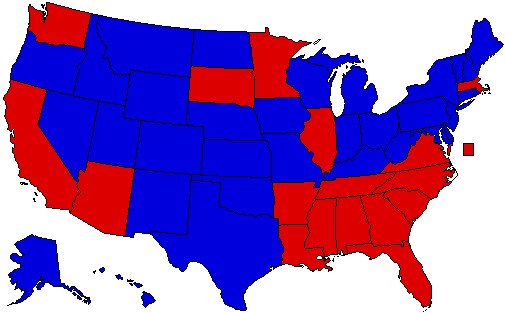
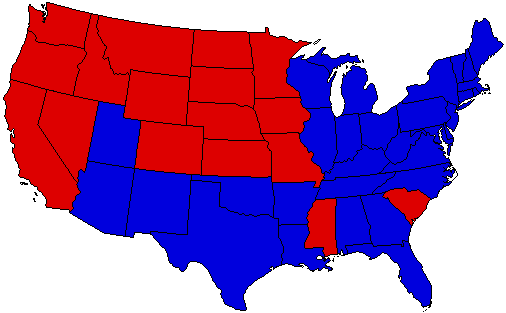
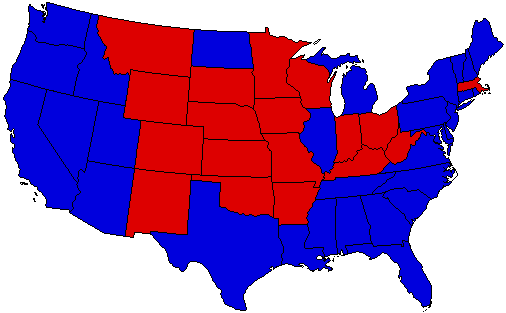
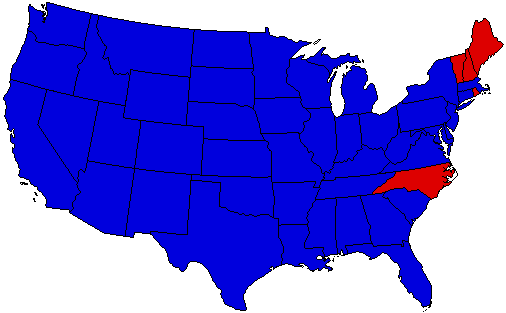
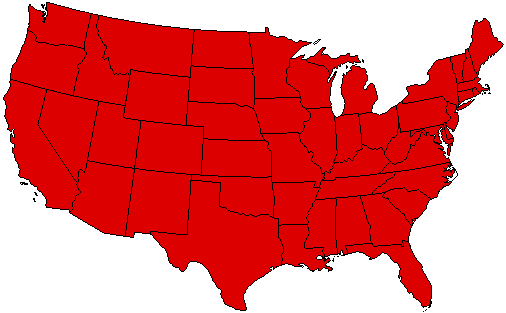
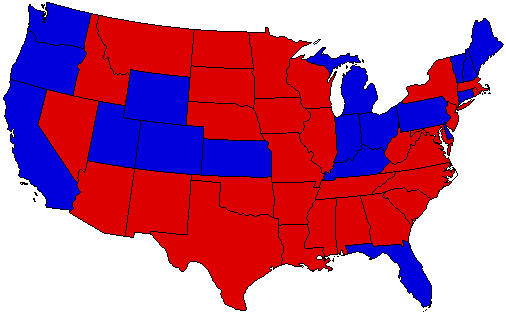
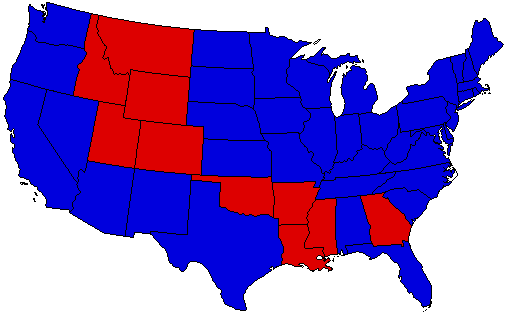
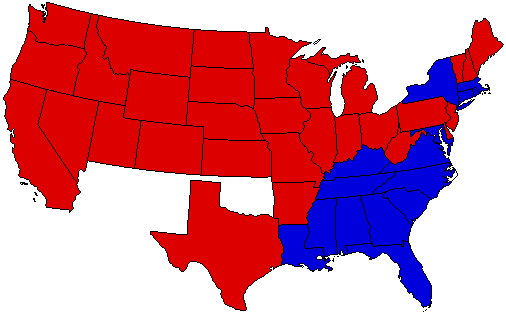
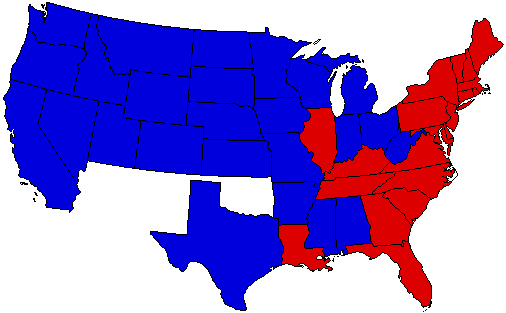
2000 Trend
( )
)
1996 Swing
( )
)
1996 Trend
( )
)
1992 Swing
( )
)
1992 Trend
( )
)
1988 Swing
( )
)
1988 Trend
( )
)
More to come as time permits, stay tuned, same bat time, same bat channel.
(
2004 Trend
(
2000 Swing
(
2000 Trend
(
1996 Swing
(
1996 Trend
(
1992 Swing
(
1992 Trend
(
1988 Swing
(
1988 Trend
(
More to come as time permits, stay tuned, same bat time, same bat channel.
Title: Re: Swing and Trend maps for each year
Post by: Nym90 on August 25, 2006, 09:36:23 AM
1984 Swing
( )
)
1984 Trend
( )
)
1980 Swing
( )
)
1980 Trend
( )
)
1976 Swing
( )
)
1976 Trend
( )
)
(
1984 Trend
(
1980 Swing
(
1980 Trend
(
1976 Swing
(
1976 Trend
(
Title: Re: Swing and Trend maps for each year
Post by: minionofmidas on August 25, 2006, 09:58:41 AM
Nice. :)
Title: Re: Swing and Trend maps for each year
Post by: nclib on August 25, 2006, 10:57:42 AM
Illinois has trended Democratic every year since (including) 1980.
Title: Re: Swing and Trend maps for each year
Post by: WalterMitty on August 25, 2006, 11:02:59 AM
Illinois has trended Democratic every year since (including) 1980.
expalin the differences between 'swing' and 'trend'
Title: Re: Swing and Trend maps for each year
Post by: nclib on August 25, 2006, 11:07:40 AM
Illinois has trended Democratic every year since (including) 1980.
expalin the differences between 'swing' and 'trend'
Swing is net difference of the two party vote from one election to the next. Trend is the state's swing minus the national swing. For example, if the nation swung 8% Republican and Texas swung 12% Republican, Texas's trend would be 4% Republican.
Title: Re: Swing and Trend maps for each year
Post by: Fmr President & Senator Polnut on August 25, 2006, 11:38:13 AM
Of course an election after a landslide like '72 or '84 would lead to some pretty serious "adjustement"
Title: Re: Swing and Trend maps for each year
Post by: Nym90 on August 25, 2006, 11:32:47 PM
1972 Swing
( )
)
1972 Trend
( )
)
1968 Swing
( )
)
1968 Trend
( )
)
1964 Swing
( )
)
1964 Trend
( )
)
(
1972 Trend
(
1968 Swing
(
1968 Trend
(
1964 Swing
(
1964 Trend
(
Title: Re: Swing and Trend maps for each year
Post by: Nym90 on August 26, 2006, 09:22:37 AM
1960 Swing
( )
)
1960 Trend
( )
)
1956 Swing
( )
)
1956 Trend
( )
)
1952 Swing
( )
)
1952 Trend
( )
)
(
1960 Trend
(
1956 Swing
(
1956 Trend
(
1952 Swing
(
1952 Trend
(
Title: Re: Swing and Trend maps for each year
Post by: Nym90 on August 28, 2006, 11:42:49 AM
1948 Swing
( )
)
1948 Trend
( )
)
1944 Swing
( )
)
1944 Trend
( )
)
1940 Swing
( )
)
1940 Trend
( )
)
(
1948 Trend
(
1944 Swing
(
1944 Trend
(
1940 Swing
(
1940 Trend
(
Title: Re: Swing and Trend maps for each year
Post by: Nym90 on August 28, 2006, 09:59:35 PM
1936 Swing
( )
)
1936 Trend
( )
)
1932 Swing
( )
)
1932 Trend
( )
)
1928 Swing
( )
)
1928 Trend
( )
)
(
1936 Trend
(
1932 Swing
(
1932 Trend
(
1928 Swing
(
1928 Trend
(
Title: Re: Swing and Trend maps for each year
Post by: DownWithTheLeft on August 29, 2006, 08:56:08 AM
NJ swinging GOP in 2004, showing 2002 really messed up the Dems.
Title: Re: Swing and Trend maps for each year
Post by: Mr. Morden on August 29, 2006, 07:31:29 PM
Nym90, this is great. Are you going to go all the way back to 1824?
Another thing that I'd be really interested in seeing at some point is a red vs. blue map for each election *relative to the national average*, so that you see a roughly equal number of "red" and "blue" states in each election. If anyone wants to do that, I've be very interested.
Another thing that I'd be really interested in seeing at some point is a red vs. blue map for each election *relative to the national average*, so that you see a roughly equal number of "red" and "blue" states in each election. If anyone wants to do that, I've be very interested.
Title: Re: Swing and Trend maps for each year
Post by: jimrtex on August 29, 2006, 08:38:30 PM
Another thing that I'd be really interested in seeing at some point is a red vs. blue map for each election *relative to the national average*, so that you see a roughly equal number of "red" and "blue" states in each election. If anyone wants to do that, I've be very interested.
Title: Re: Swing and Trend maps for each year
Post by: Nym90 on August 30, 2006, 12:17:08 AM
Nym90, this is great. Are you going to go all the way back to 1824?
Another thing that I'd be really interested in seeing at some point is a red vs. blue map for each election *relative to the national average*, so that you see a roughly equal number of "red" and "blue" states in each election. If anyone wants to do that, I've be very interested.
Another thing that I'd be really interested in seeing at some point is a red vs. blue map for each election *relative to the national average*, so that you see a roughly equal number of "red" and "blue" states in each election. If anyone wants to do that, I've be very interested.
For now just 1896, since that's as far back as Dave has Swing/Trend data available.
And "Trend" is exactly what you are talking about with your second question. Swing is simply the change in each state from one election to the next, while Trend is the difference between the national swing and the state swing (thus there will always be a roughly even split in the states that trend each way in each election).
Title: Re: Swing and Trend maps for each year
Post by: Nym90 on August 30, 2006, 12:35:43 AM
1924 Swing
( )
)
1924 Trend
( )
)
1920 Swing
( )
)
1920 Trend
( )
)
1916 Swing
( )
)
1916 Trend
( )
)
1912 Swing
( )
)
1912 Trend
( )
)
(
1924 Trend
(
1920 Swing
(
1920 Trend
(
1916 Swing
(
1916 Trend
(
1912 Swing
(
1912 Trend
(
Title: Re: Swing and Trend maps for each year
Post by: Mr. Morden on August 30, 2006, 01:51:11 PM
And "Trend" is exactly what you are talking about with your second question. Swing is simply the change in each state from one election to the next, while Trend is the difference between the national swing and the state swing (thus there will always be a roughly even split in the states that trend each way in each election).
Oh, sorry, I think my wording was off. What I really meant was, a red vs. blue map that shows the percentage of the vote in each state relative to the national average. Not the year-to-year swing relative to the national average. So, for example, in 2004, you'd have Iowa, New Mexico and Ohio for Kerry because he did better there than he did in the national popular vote. But everything else would be the same. Just so you can see "these are the states that were more Democratic or more Republican than average" even in landslide years. You already get that a little in the different shadings of the maps in the Atlas, but it's not convenient for comparing different years and so forth.
Title: Re: Swing and Trend maps for each year
Post by: Nym90 on August 30, 2006, 04:43:52 PM
1908 Swing
( )
)
1908 Trend
( )
)
1904 Swing
( )
)
1904 Trend
( )
)
1900 Swing
( )
)
1900 Trend
( )
)
1896 Swing
( )
)
1896 Trend
( )
)
(
1908 Trend
(
1904 Swing
(
1904 Trend
(
1900 Swing
(
1900 Trend
(
1896 Swing
(
1896 Trend
(
Title: Re: Swing and Trend maps for each year
Post by: Nym90 on August 30, 2006, 04:48:23 PM
And "Trend" is exactly what you are talking about with your second question. Swing is simply the change in each state from one election to the next, while Trend is the difference between the national swing and the state swing (thus there will always be a roughly even split in the states that trend each way in each election).
Oh, sorry, I think my wording was off. What I really meant was, a red vs. blue map that shows the percentage of the vote in each state relative to the national average. Not the year-to-year swing relative to the national average. So, for example, in 2004, you'd have Iowa, New Mexico and Ohio for Kerry because he did better there than he did in the national popular vote. But everything else would be the same. Just so you can see "these are the states that were more Democratic or more Republican than average" even in landslide years. You already get that a little in the different shadings of the maps in the Atlas, but it's not convenient for comparing different years and so forth.
Oh sure. I was planning to do that as my next project.