Title: Wild & Wacky Stats!
Post by: Adam Griffin on April 16, 2008, 09:47:38 AM
Please contribute:
Median Income by County 2006:
()
Percentage of people 65 and over with no natural teeth:
()
Percentage of residents who have used cocaine (2003-2004):
()
Percentage of residents who have used marijuana (2007):
()
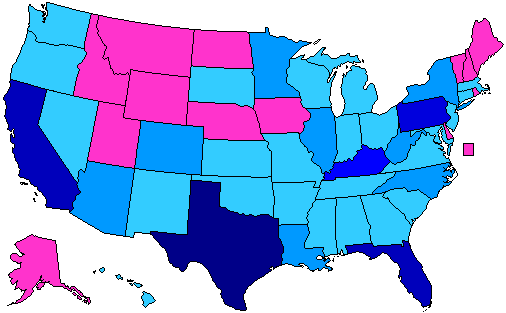
Ratio of twin births per 1,000 live births:
()
Median Income by County 2006:
()
Percentage of people 65 and over with no natural teeth:
()
Percentage of residents who have used cocaine (2003-2004):
()
Percentage of residents who have used marijuana (2007):
()
Ratio of twin births per 1,000 live births:
()
Title: Re: Wild & Wacky Stats!
Post by: Alcon on April 16, 2008, 11:12:09 AM
Is anyone else a little weirded out that Nevada has one of the lowest rates of cocaine use?
Title: Re: Wild & Wacky Stats!
Post by: Filuwaúrdjan on April 16, 2008, 11:13:44 AM
Is anyone else a little weirded out that Nevada has one of the lowest rates of cocaine use?
Maybe not if it's based on residents
Title: Re: Wild & Wacky Stats!
Post by: Alcon on April 16, 2008, 11:15:30 AM
Is anyone else a little weirded out that Nevada has one of the lowest rates of cocaine use?
Maybe not if it's based on residents
Seems like it would be readily available, and God knows I'd be on all kinds of narcotics if I had to live in Nevada.
Title: Re: Wild & Wacky Stats!
Post by: Adam Griffin on April 16, 2008, 11:20:48 AM
I found it very odd that on the twin map, there is such a concentration of states in the Northeast with abnormally high ratios of twins. The map I made doesn't do full justice; almost every state in the Northeast was in the top ten, while the West was fairly devoid of twins.
Title: Re: Wild & Wacky Stats!
Post by: Adam Griffin on April 16, 2008, 11:54:04 AM
Amount Exported to Iran (per 100 people):
()
Children ages 0-5 who are read to everyday:
()
Children 0-18 who attend weekly religious services:
()
()
Children ages 0-5 who are read to everyday:
()
Children 0-18 who attend weekly religious services:
()
Title: Re: Wild & Wacky Stats!
Post by: Brittain33 on April 16, 2008, 02:21:17 PM
I found it very odd that on the twin map, there is such a concentration of states in the Northeast with abnormally high ratios of twins. The map I made doesn't do full justice; almost every state in the Northeast was in the top ten, while the West was fairly devoid of twins.
It's a measure of affluent families using fertility treatments. National Geographic profiled the upper middle class suburb of Bridgewater, NJ in their old Zip code feature because of the extraordinary number of multiple births.
Title: Re: Wild & Wacky Stats!
Post by: Alcon on April 16, 2008, 03:16:09 PM
I found it very odd that on the twin map, there is such a concentration of states in the Northeast with abnormally high ratios of twins. The map I made doesn't do full justice; almost every state in the Northeast was in the top ten, while the West was fairly devoid of twins.
It's a measure of affluent families using fertility treatments. National Geographic profiled the upper middle class suburb of Bridgewater, NJ in their old Zip code feature because of the extraordinary number of multiple births.
Why not affluent areas of the West? Less social pressure?
Title: Re: Wild & Wacky Stats!
Post by: Brittain33 on April 16, 2008, 03:31:38 PM
Why not affluent areas of the West? Less social pressure?
That's a good question. Some thoughts:
States with larger immigrant populations, particularly immigrants from lower economic strata than those that make up northeastern immigrant communities, are going to have a lot more of their children in the population. NJ has a large immigrant population, but many of them come to the U.S. with college degrees or an ethos of putting off children, and like CT it has a small urban:suburban ratio.
The northeast not only has more affluent families, but people marry later and women tend to work longer before starting families. My sister in NJ was 29 when she had her first son and she was the first of any of her friends to become a mother. Of the people I know, very few had children in their 20s and plan for them in their 30s. I suspect the situation is different in middle-class areas like north Dallas or Mesa, AZ.
I should find the National Geographic article.
Title: Re: Wild & Wacky Stats!
Post by: Josh/Devilman88 on April 16, 2008, 04:01:09 PM
Why not affluent areas of the West? Less social pressure?
That's a good question. Some thoughts:
States with larger immigrant populations, particularly immigrants from lower economic strata than those that make up northeastern immigrant communities, are going to have a lot more of their children in the population. NJ has a large immigrant population, but many of them come to the U.S. with college degrees or an ethos of putting off children, and like CT it has a small urban:suburban ratio.
The northeast not only has more affluent families, but people marry later and women tend to work longer before starting families. My sister in NJ was 29 when she had her first son and she was the first of any of her friends to become a mother. Of the people I know, very few had children in their 20s and plan for them in their 30s. I suspect the situation is different in middle-class areas like north Dallas or Mesa, AZ.
I should find the National Geographic article.
Most pepole in NC have kids by their mid to late 20's in NC
Title: Re: Wild & Wacky Stats!
Post by: Filuwaúrdjan on April 16, 2008, 06:03:48 PM
()
By output area (lowest level they publically release census data here). Pattern is as expected, but interesting anyway.
By output area (lowest level they publically release census data here). Pattern is as expected, but interesting anyway.
Title: Re: Wild & Wacky Stats!
Post by: jimrtex on April 17, 2008, 02:07:01 AM
I found it very odd that on the twin map, there is such a concentration of states in the Northeast with abnormally high ratios of twins. The map I made doesn't do full justice; almost every state in the Northeast was in the top ten, while the West was fairly devoid of twins.
Title: Re: Wild & Wacky Stats!
Post by: phk on April 17, 2008, 04:52:35 AM
Quote
Amount Exported to Iran (per 100 people):
?????????
Title: Re: Wild & Wacky Stats!
Post by: minionofmidas on April 17, 2008, 07:19:50 AM
()
By output area (lowest level they publically release census data here). Pattern is as expected, but interesting anyway.
By output area (lowest level they publically release census data here). Pattern is as expected, but interesting anyway.
Title: Re: Wild & Wacky Stats!
Post by: Adam Griffin on April 17, 2008, 07:35:21 AM
Quote
Amount Exported to Iran (per 100 people):
?????????
It's the dollar amount exported annually by a state for every 100 residents. Divide it by 100 and that's the monetary amount of goods exported annually for each resident of the state.
Title: Re: Wild & Wacky Stats!
Post by: Adam Griffin on April 17, 2008, 07:56:04 AM
Ability to save financially:
()
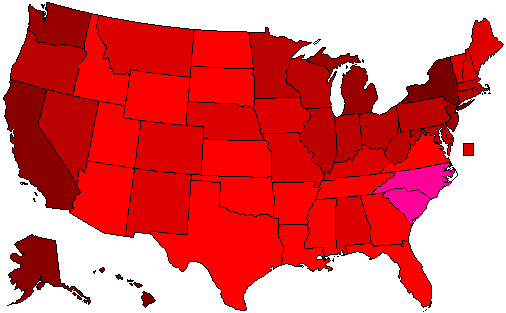
Firearm deaths per 100,000 people:
()
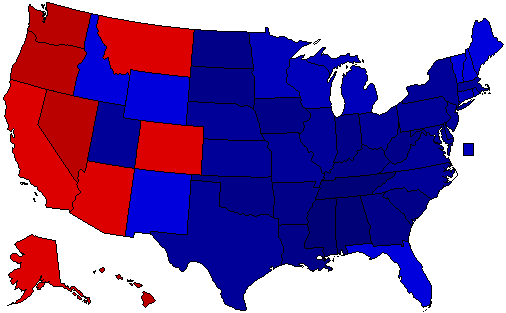
Wal-mart vs. Starbucks - Which has more stores:
()
()
Firearm deaths per 100,000 people:
()
Wal-mart vs. Starbucks - Which has more stores:
()
Title: Re: Wild & Wacky Stats!
Post by: Brittain33 on April 17, 2008, 09:10:40 AM
Starbucks doing better than Wal*Mart even in Utah. Wow.
Title: Re: Wild & Wacky Stats!
Post by: bgwah on April 17, 2008, 09:37:20 AM
Adam, you better make a shaded version of the Starbucks vs. Wal-Mart map!
Anyway, here are some random maps I made (and posted) a while ago:
Cremated vs. not cremated
( )
)
http://www.statemaster.com/graph/lif_cre_of_dec_cre-lifestyle-cremation-of-deceased-cremated
Sam's Club vs. Costco
( )
)
Virginia is the only thing that strikes me as strange, which Costco won 14-13. Delaware is a tie. None in D.C. Vermont had one Costco and nothing else, while Rhode Island had one Sam's Club and nothing else.
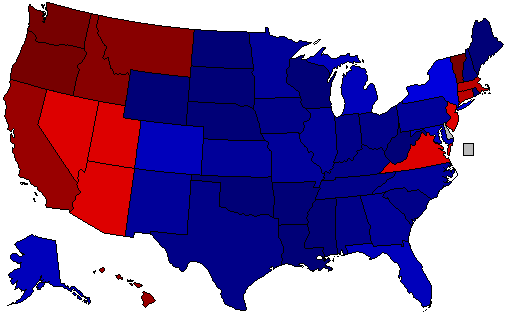
Target (red) vs. Wal-Mart (blue)
Wal-Mart vs. Target. Didn't think about K-Mart... But then again there are lot of stores I could probably include, like Kroger and all the chains it owns.
( )
)
McDonalds (blue) vs. Starbucks (red), AR at 89% McD and WA at 69% Sbux.
( )
)
Anyway, here are some random maps I made (and posted) a while ago:
Cremated vs. not cremated
(
http://www.statemaster.com/graph/lif_cre_of_dec_cre-lifestyle-cremation-of-deceased-cremated
Sam's Club vs. Costco
(
Virginia is the only thing that strikes me as strange, which Costco won 14-13. Delaware is a tie. None in D.C. Vermont had one Costco and nothing else, while Rhode Island had one Sam's Club and nothing else.
Target (red) vs. Wal-Mart (blue)
Wal-Mart vs. Target. Didn't think about K-Mart... But then again there are lot of stores I could probably include, like Kroger and all the chains it owns.
(
McDonalds (blue) vs. Starbucks (red), AR at 89% McD and WA at 69% Sbux.
(
Title: Re: Wild & Wacky Stats!
Post by: Filuwaúrdjan on April 17, 2008, 09:53:07 AM
()
By output area (lowest level they publically release census data here). Pattern is as expected, but interesting anyway.
By output area (lowest level they publically release census data here). Pattern is as expected, but interesting anyway.
Smallest geographical area that the ONS releases data for. Usually a few hundred people in one, sometimes more.
As for where is where...
1. The area that's majority Welsh speaking (defined here as people claiming to be able to speak, read and write Welsh in the last census) is mostly public sector middle class suburbs, but also, I think, Bryn Adda (furthest east of the oa's) which is IIRC mostly council-built housing. The oa's east of that group with high %'s are mostly council-built as well.
2. The other two areas with high %'s are Maesgeirchen (a big council estate) and Hirael (19th century working class district, gentrified in parts).
3. The two areas with the lowest %'s both have lots of students and the like; the big one by the Menai includes the main Uni halls of residence, the areas in the centre of the seat are more in the way of students renting privately.
4. the oa that includes the main site of the Uni doesn't have a very low % though. That's because it also includes JMJ (http://www.bangor.ac.uk/accommodation/halls/jmj.php.en). That oa is the one next to the big pale one.
Can give a lot more detail about most of the city if you want.
Title: Re: Wild & Wacky Stats!
Post by: Sensei on April 17, 2008, 11:56:29 AM
Compare the Marijuana map with the children being read to map..
Looks like some kids are getting "High Times" read to them.
Looks like some kids are getting "High Times" read to them.
Title: Re: Wild & Wacky Stats!
Post by: specific_name on April 17, 2008, 12:04:21 PM
Maps + nearly meaningless stats = awesome. I want to make some of my own...when I get the time. I would like to do a set of shaded maps for various common ethnicities (by county or state).
Title: Re: Wild & Wacky Stats!
Post by: Joe Republic on April 17, 2008, 12:34:14 PM
Number of federal prisons:
( )
)
D >20% = 0
R >20% = 1-2
R >30% = 3-4
R >40% = 5-6
R >50% = 7-8
R >60% = 9-10
R >70% = 11-12
R >80% = 13-14
(
D >20% = 0
R >20% = 1-2
R >30% = 3-4
R >40% = 5-6
R >50% = 7-8
R >60% = 9-10
R >70% = 11-12
R >80% = 13-14
Title: Re: Wild & Wacky Stats!
Post by: Adam Griffin on April 17, 2008, 12:46:26 PM
These maps have the states placed in groups of 10; darkest shade represents 10 states that ranked highest in the specific category, lightest represents 10 lowest in category):
Healthiness of states:
()
Lynchings by state (1882-1968):
()
Healthiness of states:
()
Lynchings by state (1882-1968):
()
Title: Re: Wild & Wacky Stats!
Post by: Filuwaúrdjan on April 17, 2008, 01:04:00 PM
What's the key and source(s) to the lynching map?
Title: Re: Wild & Wacky Stats!
Post by: Joe Republic on April 17, 2008, 01:17:23 PM
Al, you might appreciate this one :) :
Union members as percentage of total employed
( )
)
D >30% = 0.0%-4.9%
D >40% = 5.0%-8.9%
D >50% = 9.0%-12.9%
D >60% = 13.0%-16.9%
D >70% = 17.0%-20.9%
D >80% = 21.0%-24.9%
D >90% = 25.0%-28.9%
Union members as percentage of total employed
(
D >30% = 0.0%-4.9%
D >40% = 5.0%-8.9%
D >50% = 9.0%-12.9%
D >60% = 13.0%-16.9%
D >70% = 17.0%-20.9%
D >80% = 21.0%-24.9%
D >90% = 25.0%-28.9%
Title: Re: Wild & Wacky Stats!
Post by: Хahar 🤔 on April 17, 2008, 01:29:07 PM
I think that these are the sorts of topics that actually drive females away.
Title: Re: Wild & Wacky Stats!
Post by: Joe Republic on April 17, 2008, 01:41:54 PM
I think that these are the sorts of topics that actually drive females away.
Oh I strongly disagree.
()
Title: Re: Wild & Wacky Stats!
Post by: Adam Griffin on April 17, 2008, 02:26:33 PM
What's the key and source(s) to the lynching map?
UMKC School of Law.
Title: Re: Wild & Wacky Stats!
Post by: Ban my account ffs! on April 20, 2008, 10:45:32 PM
Percentage uninsured by state:
( )
)
30%: <9%
40%: 9.0-10.9%
50%: 11.0-12.9%
60%: 13.0-14.9%
70%: 15.0-16.9%
80%: 17.0-18.9%
90%: >19%
(
30%: <9%
40%: 9.0-10.9%
50%: 11.0-12.9%
60%: 13.0-14.9%
70%: 15.0-16.9%
80%: 17.0-18.9%
90%: >19%
Title: Re: Wild & Wacky Stats!
Post by: Padfoot on April 21, 2008, 12:59:14 AM
Number of federal prisons:
()
D >20% = 0
R >20% = 1-2
R >30% = 3-4
R >40% = 5-6
R >50% = 7-8
R >60% = 9-10
R >70% = 11-12
R >80% = 13-14
(
D >20% = 0
R >20% = 1-2
R >30% = 3-4
R >40% = 5-6
R >50% = 7-8
R >60% = 9-10
R >70% = 11-12
R >80% = 13-14
We need to put some more federal prisons in Alaska. That'd probably serve as somewhat of a deterrent. lol.
Title: Re: Wild & Wacky Stats!
Post by: ?????????? on April 21, 2008, 02:56:21 AM
Where do you all find this kind of info at?
Title: Re: Wild & Wacky Stats!
Post by: Brittain33 on April 21, 2008, 09:20:34 AM
We need to put some more federal prisons in Alaska. That'd probably serve as somewhat of a deterrent. lol.
Yes, the one thing Alaska and its government need is yet another form of rent-seeking. :)
Title: Re: Wild & Wacky Stats!
Post by: Adam Griffin on April 28, 2008, 01:37:44 PM
Taxation by State:
()
Bankruptcy by State:
()
Forced Rape Per Capita by State (per 1,000 people):
()
Oil Consumption Per Capita by State:
()
Chlamydia Rates by State (per 100,000):
()
()
Bankruptcy by State:
()
Forced Rape Per Capita by State (per 1,000 people):
()
Oil Consumption Per Capita by State:
()
Chlamydia Rates by State (per 100,000):
()
Title: Re: Wild & Wacky Stats!
Post by: Brittain33 on April 28, 2008, 08:42:50 PM
How do you measure taxation by state? It looks like combined federal and state per capita in absolute dollars, not state alone, and not as a percentage of income.
Title: Re: Wild & Wacky Stats!
Post by: 7,052,770 on April 29, 2008, 12:13:20 AM
Firearm deaths per 100,000 people:
()
()
Title: Re: Wild & Wacky Stats!
Post by: Verily on April 29, 2008, 02:02:43 AM
More like only conservatives shoot people. Unless they're Mormons. :P
Title: Re: Wild & Wacky Stats!
Post by: they don't love you like i love you on April 29, 2008, 08:30:05 PM
Maine certainly has laxer gun laws than DC.
Title: Re: Wild & Wacky Stats!
Post by: Hatman 🍁 on April 29, 2008, 08:45:40 PM
Maine certainly has laxer gun laws than DC.
()
Title: Re: Wild & Wacky Stats!
Post by: Ban my account ffs! on April 29, 2008, 08:46:25 PM
Maine certainly has laxer gun laws than DC.
It's not the idea of allowing responsible, educated citizens to own guns that disgusts me... it's the idea that "if we just give guns to the teachers, there won't be school shootings" that really gets me.
Title: Re: Wild & Wacky Stats!
Post by: they don't love you like i love you on April 29, 2008, 08:48:35 PM
Maine certainly has laxer gun laws than DC.
()
You know which party controlled the Minnesota State Senate when the concealed carry law was passed? It wasn't the Libertarians (or Republicans for that matter...)
Maine certainly has laxer gun laws than DC.
It's not the idea of allowing responsible, educated citizens to own guns that disgusts me... it's the idea that "if we just give guns to the teachers, there won't be school shootings" that really gets me.
I don't think anyone other than radical Libertarians promote that sort of thing, nor is that the law anywhere.
Title: Re: Wild & Wacky Stats!
Post by: Ban my account ffs! on April 29, 2008, 08:53:47 PM
Maine certainly has laxer gun laws than DC.
()
No, more like
Ending () is more important than ()
AND
Working to end () while investing in () will likely lead to less ()
Shallow and direct responses that seek to superficially solve deeply interconnected societal problems never work. There is always an indirect, less obvious, but (in the longer term) more effective way to solve our problems.
Title: Re: Wild & Wacky Stats!
Post by: nclib on April 29, 2008, 09:04:07 PM
How do you measure taxation by state? It looks like combined federal and state per capita in absolute dollars, not state alone, and not as a percentage of income.
Not sure how this was measured, but if it were absolute dollars, California would be way higher than Mississippi.
Title: Re: Wild & Wacky Stats!
Post by: Adam Griffin on May 01, 2008, 12:01:30 PM
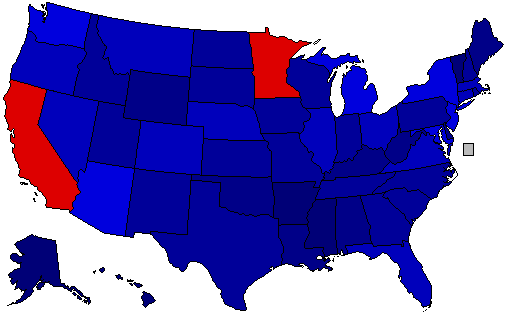
Percentage of Married Couples with Both Spouses in the Workforce:
()
()
Title: Re: Wild & Wacky Stats!
Post by: Хahar 🤔 on May 01, 2008, 07:57:18 PM
Percentage of Married Couples with Both Spouses in the Workforce:
()
()
I have no idea what to make of those numbers. None.
Title: Re: Wild & Wacky Stats!
Post by: Brittain33 on May 01, 2008, 08:23:02 PM
I have no idea what to make of those numbers. None.
1. Farmers
2. Middle-class professionals
as opposed to
3. Economically depressed areas with no jobs to spare (Appalachia, mitigating in N.Y., Penn., Michigan)
4. Places with lots of construction (I have no idea if that's causation, but what else links California, Florida, and Arizona?)
4a. Duh. Retirees.
Title: Re: Wild & Wacky Stats!
Post by: they don't love you like i love you on May 02, 2008, 01:59:06 AM
Anyone got any maps on alcohol consumption? Or underage alcohol consumption? I know that North Dakota is #1 in the latter (there's at least one thing about the state to be proud of!)
Title: Re: Wild & Wacky Stats!
Post by: nclib on May 02, 2008, 04:29:12 PM
I have no idea what to make of those numbers [Percentage of Married Couples with Both Spouses in the Workforce]:. None.
1. Farmers
2. Middle-class professionals
as opposed to
3. Economically depressed areas with no jobs to spare (Appalachia, mitigating in N.Y., Penn., Michigan)
4. Places with lots of construction (I have no idea if that's causation, but what else links California, Florida, and Arizona?)
4a. Duh. Retirees.
Of course retirees skew the data, but in general I was expecting the liberal states to be more supportive of women in the workplace.
Regarding farmers, brittain, are you saying that the Midwest has high employment rate of both spouses because of couples that live/work on farms?
Title: Re: Wild & Wacky Stats!
Post by: Verily on May 02, 2008, 04:47:06 PM
I have no idea what to make of those numbers [Percentage of Married Couples with Both Spouses in the Workforce]:. None.
1. Farmers
2. Middle-class professionals
as opposed to
3. Economically depressed areas with no jobs to spare (Appalachia, mitigating in N.Y., Penn., Michigan)
4. Places with lots of construction (I have no idea if that's causation, but what else links California, Florida, and Arizona?)
4a. Duh. Retirees.
Of course retirees skew the data, but in general I was expecting the liberal states to be more supportive of women in the workplace.
Regarding farmers, brittain, are you saying that the Midwest has high employment rate of both spouses because of couples that live/work on farms?
It's much more driven by economic conditions than anything else. In economically depressed areas (Michigan, Oregon, West Virginia), fewer couples will both be working because there aren't many jobs to begin with.
There's some social aspect to it, too, but the Plains were always on the forefront of women's rights.
Title: Re: Wild & Wacky Stats!
Post by: Brittain33 on May 02, 2008, 09:50:48 PM
Regarding farmers, brittain, are you saying that the Midwest has high employment rate of both spouses because of couples that live/work on farms?
My understanding is that most people who have farms need to work jobs off of the farm in order to make a living year round. I would imagine this means wives have to work, too, especially if part of the year the husband is investing energy in the farm without short-term reward.
But then again, how many people are still living in farms in some of those places?
Title: Re: Wild & Wacky Stats!
Post by: ?????????? on May 02, 2008, 10:46:03 PM
Percentage of Married Couples with Both Spouses in the Workforce:
()
()
I have no idea what to make of those numbers. None.
Try, "Glad to see the south is progressive in yet another area."
Title: Re: Wild & Wacky Stats!
Post by: they don't love you like i love you on May 02, 2008, 11:35:59 PM
But then again, how many people are still living in farms in some of those places?
Not many.
Title: Re: Wild & Wacky Stats!
Post by: Verily on May 03, 2008, 01:57:21 AM
Percentage of Married Couples with Both Spouses in the Workforce:
()
()
I have no idea what to make of those numbers. None.
Try, "Glad to see the south is progressive in yet another area."
Err... the South does not appear to be doing too well on that map.
Title: Re: Wild & Wacky Stats!
Post by: Ban my account ffs! on May 03, 2008, 11:19:31 AM
Percentage of Married Couples with Both Spouses in the Workforce:
()
()
I have no idea what to make of those numbers. None.
Try, "Glad to see the south is progressive in yet another area."
Err... the South does not appear to be doing too well on that map.
This map is not surprising at all. Places in the upper midwest have long had a reputation of hard work ethics. I'd say a combination of poverty and social conservatism tends to lead to lower workforce participation among married women. They either can't find a job or they don't want one, citing "traditional values".
Title: Re: Wild & Wacky Stats!
Post by: Хahar 🤔 on May 03, 2008, 01:35:01 PM
I'm still confused about California, though. There are poors, jobs, and farmers.
Title: Re: Wild & Wacky Stats!
Post by: Verily on May 03, 2008, 01:49:38 PM
I'm still confused about California, though. There are poors, jobs, and farmers.
Hispanic migrant workers DNE Plains farmers. And the extreme wealth of much of the white population (and WASPiness) lends itself to fewer working women, too.
Title: Re: Wild & Wacky Stats!
Post by: jimrtex on May 03, 2008, 04:57:36 PM
Percentage of Married Couples with Both Spouses in the Workforce:
()
()
I have no idea what to make of those numbers. None.
Try, "Glad to see the south is progressive in yet another area."
Err... the South does not appear to be doing too well on that map.
This map is not surprising at all. Places in the upper midwest have long had a reputation of hard work ethics. I'd say a combination of poverty and social conservatism tends to lead to lower workforce participation among married women. They either can't find a job or they don't want one, citing "traditional values".
AZ-4 (Phoenix)
CA-31,34 (Los Angeles & SE suburbs)
FL-5,13,14,16,19 (W Coast, north of St. Pete, south of St. Pete, and inland Palm Beach)
IL-4 (Chicago)
KY-5 (Eastern)
NY-16 (Bronx)
TX-15,16,29 (South, El Paso, and Houston)
WV-3 (South)
Below 45%
AZ-1,2,7 (Southwest, and North)
CA-18,20,28,32,33,35,37,38,39,41,43,45,47,51 (Mostly LA)
FL-15,18
LA-3 (Acadia)
MI-13,14 (Detroit)
NJ-13 (Jersey Shore of Hudson)
NM-2 (South)
NY-5,7,8,9,10,12,13 (NYC)
OK-2 (East)
PA-1 (Philadelphia)
TX-18,27,28 (Houston, and South)
Those over 60%
CO-2,6 (Denver suburban)
CT-2 (east)
GA-7 (Atlanta suburban north)
IA-2,3,4,5 (All but eastern)
MD-4,5 (DC suburbs, exurbs)
MN-1,2,3,4,5,6,7 (All but northeast). MN-2 (southern Twin Cities sub/ex-urbs is national leader at 69.8%.
NE-1,2,3 (all)
NH-1,2 (all)
NC-4 (Research Triangle)
ND-AL
O-15 (Columbus west)
SD-AL
TX-24 (Mid Cities)
VT-AL
VA-8,10,11 (NOVA)
Title: Re: Wild & Wacky Stats!
Post by: Willy Woz on May 03, 2008, 05:57:57 PM
Opposition to homosexuality (DOMA):
( )
)
(
Title: Re: Wild & Wacky Stats!
Post by: Alcon on May 03, 2008, 06:03:24 PM
Opposition to homosexuality (DOMA):
()
(
"Opposition to homosexuality"? Not...really.
And not an especially meaningful map for various reasons.
Title: Re: Wild & Wacky Stats!
Post by: Willy Woz on May 03, 2008, 06:08:12 PM
"Opposition to homosexuality"? Not...really.
Why not? Even you say that DOMA supporters are homophoic.
Title: Re: Wild & Wacky Stats!
Post by: Ban my account ffs! on May 03, 2008, 06:20:19 PM
"Opposition to homosexuality"? Not...really.
Why not? Even you say that DOMA supporters are homophoic.
Oh, please. I don't care, if you support something as retarded and ill-thought-out as Defense of Marriage, then you are homophobic.
If you aren't homophobic, then what is wrong with giving gays and lesbians equal access to the benefits that heterosexual couples enjoy?
There is no other reason except that you think homosexual couples deserve less, lest heterosexuals somehow spontaneously combust when two women tie the knot.
IF YOU DON'T LIKE GAY MARRIAGE, DON'T HAVE ONE. End of story.
Title: Re: Wild & Wacky Stats!
Post by: Alcon on May 03, 2008, 06:25:21 PM
"Opposition to homosexuality"? Not...really.
Why not? Even you say that DOMA supporters are homophoic.
I don't recall saying that. Some are, many just honestly believe their religion requires them to not support any governmental recognition.
But using that map to gauge opposition to homosexuality is wrong on other levels too.
Title: Re: Wild & Wacky Stats!
Post by: Willy Woz on May 03, 2008, 06:26:40 PM
"Opposition to homosexuality"? Not...really.
Why not? Even you say that DOMA supporters are homophoic.
I don't recall saying that. Some are, many just honestly believe their religion requires them to not support any governmental recognition.
But using that map to gauge opposition to homosexuality is wrong on other levels too.
Yeah, I guess you're right. After all, many states with DOMAs also consistently favor civil unions in polls. The South being an exception of course...
Title: Re: Wild & Wacky Stats!
Post by: nclib on May 03, 2008, 08:49:46 PM
Percentage of Married Couples with Both Spouses in the Workforce:
()
()
I have no idea what to make of those numbers. None.
Try, "Glad to see the south is progressive in yet another area."
Err... the South does not appear to be doing too well on that map.
This map is not surprising at all. Places in the upper midwest have long had a reputation of hard work ethics. I'd say a combination of poverty and social conservatism tends to lead to lower workforce participation among married women. They either can't find a job or they don't want one, citing "traditional values".
AZ-4 (Phoenix)
CA-31,34 (Los Angeles & SE suburbs)
FL-5,13,14,16,19 (W Coast, north of St. Pete, south of St. Pete, and inland Palm Beach)
IL-4 (Chicago)
KY-5 (Eastern)
NY-16 (Bronx)
TX-15,16,29 (South, El Paso, and Houston)
WV-3 (South)
Below 45%
AZ-1,2,7 (Southwest, and North)
CA-18,20,28,32,33,35,37,38,39,41,43,45,47,51 (Mostly LA)
FL-15,18
LA-3 (Acadia)
MI-13,14 (Detroit)
NJ-13 (Jersey Shore of Hudson)
NM-2 (South)
NY-5,7,8,9,10,12,13 (NYC)
OK-2 (East)
PA-1 (Philadelphia)
TX-18,27,28 (Houston, and South)
Those over 60%
CO-2,6 (Denver suburban)
CT-2 (east)
GA-7 (Atlanta suburban north)
IA-2,3,4,5 (All but eastern)
MD-4,5 (DC suburbs, exurbs)
MN-1,2,3,4,5,6,7 (All but northeast). MN-2 (southern Twin Cities sub/ex-urbs is national leader at 69.8%.
NE-1,2,3 (all)
NH-1,2 (all)
NC-4 (Research Triangle)
ND-AL
O-15 (Columbus west)
SD-AL
TX-24 (Mid Cities)
VT-AL
VA-8,10,11 (NOVA)
From that list, aside from the Florida ones which are skewed by retirees, it looks like in general this is correlated with economic conditions. It also seems that districts with a high Hispanic population make up the first two lists, which could be due to economic conditions or traditional values.
Edit: In fact the first list, aside from the Florida ones (retirees), all are majority-Hispanic districts except for KY-5 and WV-3 (poor, rural, Appalachian whites).
Title: Re: Wild & Wacky Stats!
Post by: Ban my account ffs! on May 04, 2008, 01:19:05 PM
( )
)
The number of megawatts of wind energy produced per 1000 people by state.
Wyoming and Iowa lead with North Dakota, New Mexico, and Minnesota rounding out the top 5. The red represents less than 0.01 megawatts per 1000 people.
The top 5 states for absolute wind power production are:
1) Texas
2) California
3) Iowa
4) Minnesota
5) Washington
These numbers were as of 2007. Minnesota is expected to surpass Iowa in absolute numbers as the industry is exploding in the state.
Title: Re: Wild & Wacky Stats!
Post by: Brittain33 on May 05, 2008, 08:53:53 AM
My regional energy provider is planning to offer wind power from Maine this summer. I wonder if they're transmitting from Canada or the project came on line too recently for these data.
Title: Re: Wild & Wacky Stats!
Post by: Adam Griffin on May 05, 2008, 10:56:22 AM
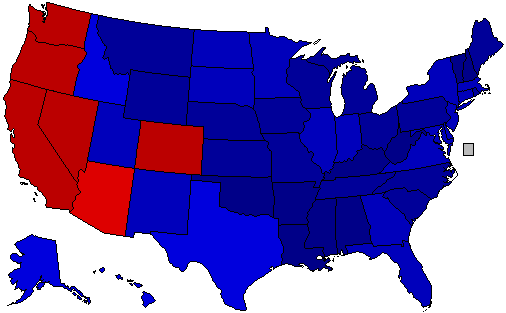
Percentage of People Who Abuse Alcohol by State:
()
Percentage of People Who Casually Drink Alcohol by State:
()
Looks like people in the Midwest with high work ethic reward themselves with 30 beers after a long day at the job. ;)
()
Percentage of People Who Casually Drink Alcohol by State:
()
Looks like people in the Midwest with high work ethic reward themselves with 30 beers after a long day at the job. ;)
Title: Re: Wild & Wacky Stats!
Post by: Willy Woz on May 05, 2008, 03:05:25 PM
Percentage of People Who Abuse Alcohol by State:
()
()
This has all the looks of "bogus". Why the fock would anybody answer a question like that?
Title: Re: Wild & Wacky Stats!
Post by: Joe Republic on May 05, 2008, 03:07:53 PM
This has all the looks of "bogus". Why the fock would anybody answer a question like that?
The data would not have been gathered by participant self-assessment, I would expect.
Title: Re: Wild & Wacky Stats!
Post by: Willy Woz on May 05, 2008, 03:11:17 PM
This has all the looks of "bogus". Why the fock would anybody answer a question like that?
The data would not have been gathered by participant self-assessment, I would expect.
I doubt it's too accurate. The states with the most dry counties should have the lowest alcohol consumption rate.
Title: Re: Wild & Wacky Stats!
Post by: Joe Republic on May 05, 2008, 03:27:39 PM
This has all the looks of "bogus". Why the fock would anybody answer a question like that?
The data would not have been gathered by participant self-assessment, I would expect.
I doubt it's too accurate. The states with the most dry counties should have the lowest alcohol consumption rate.
I'll reserve judgement on its accuracy for now, but the data displays alcohol abuse, not consumption.
Title: Re: Wild & Wacky Stats!
Post by: Aizen on May 05, 2008, 05:28:50 PM
Pop vs Soda vs Coke (WTF?)
( )
)
(
Title: Re: Wild & Wacky Stats!
Post by: Ban my account ffs! on May 05, 2008, 06:54:36 PM
This has all the looks of "bogus". Why the fock would anybody answer a question like that?
The data would not have been gathered by participant self-assessment, I would expect.
I doubt it's too accurate. The states with the most dry counties should have the lowest alcohol consumption rate.
Look, mommy! It's the thought process of a 6 year old!
Alcohol consumption has always been high in the upper-midwest. It is just more a part of our culture than it is in other areas of the country. Having some wine with dinner or a few beers while you grill is not frowned upon.
What is surprising and alarming is the high rate of binge drinking in the upper-midwest. I think it has a lot to do with the long winters. But I don't think our rates are any higher than the rates of western Europe. It's just that the rest of America is quite conservative.
Title: Re: Wild & Wacky Stats!
Post by: Speed of Sound on May 05, 2008, 07:01:19 PM
Pop vs Soda vs Coke (WTF?)
()
(
Title: Re: Wild & Wacky Stats!
Post by: Verily on May 05, 2008, 07:24:59 PM
Pop vs Soda vs Coke (WTF?)
()
(
There's a map online that aggregates a huge number of responses; it's actually really interesting. I'll see if I can find it.
Title: Re: Wild & Wacky Stats!
Post by: Verily on May 05, 2008, 07:26:17 PM
Here it is: http://popvssoda.com:2998/countystats/total-county.html
Title: Re: Wild & Wacky Stats!
Post by: Aizen on May 05, 2008, 07:51:16 PM
Yeah, looking at that map, you'd think Wisconsin and perhaps Pennsylvania would be flipped but according to http://popvssoda.com:2998/stats/ALL.html (http://popvssoda.com:2998/stats/ALL.html), nope, not the case. I wonder if they did the ole' switcharoo on accident. This study was done from Oklahoma after all.
Anywho, it is "Soda". "Pop" is wrong and "Coke" is just flat out retarded. Although when you look at which states call our carbonated beverages just that, it isn't too terribly surprising.
Anywho, it is "Soda". "Pop" is wrong and "Coke" is just flat out retarded. Although when you look at which states call our carbonated beverages just that, it isn't too terribly surprising.
Title: Re: Wild & Wacky Stats!
Post by: Josh/Devilman88 on May 05, 2008, 08:05:20 PM
Pop vs Soda vs Coke (WTF?)
()
(
There's a map online that aggregates a huge number of responses; it's actually really interesting. I'll see if I can find it.
All NC should be blue. I have never heard anyone call Soda, "Coke".
Title: Re: Wild & Wacky Stats!
Post by: Alcon on May 05, 2008, 08:08:04 PM
Here it is: http://popvssoda.com:2998/countystats/total-county.html
I love how that map picks up on a bunch of other things (like Blaine County, ID, being infested with Californians :P)
Title: Re: Wild & Wacky Stats!
Post by: Verily on May 05, 2008, 08:12:29 PM
Here it is: http://popvssoda.com:2998/countystats/total-county.html
I love how that map picks up on a bunch of other things (like Blaine County, ID, being infested with Californians :P)
That's why I said it was really interesting. It also has a very neat demonstration of Midwest media markets (Indianapolis: coke; Chicago: pop; St. Louis: soda; Milwaukee: soda; Twin Cities: pop).
Title: Re: Wild & Wacky Stats!
Post by: jimrtex on May 06, 2008, 01:54:11 AM
Anywho, it is "Soda". "Pop" is wrong and "Coke" is just flat out retarded. Although when you look at which states call our carbonated beverages just that, it isn't too terribly surprising.
I think it is pretty retarded to drop the noun and retain the adjective from "soda pop"
People in the South do not use Coke as a generic word for pop. They use it as an example. As in "do you want a Coke or something? I think there's a couple of cans of orange." It's just like if you go into a restaurant, the waitress will ask if you would like some tea. It doesn't mean that they won't serve coffee or don't know what coffee is.
Title: Re: Wild & Wacky Stats!
Post by: muon2 on May 06, 2008, 06:34:37 AM
Anywho, it is "Soda". "Pop" is wrong and "Coke" is just flat out retarded. Although when you look at which states call our carbonated beverages just that, it isn't too terribly surprising.
I think it is pretty retarded to drop the noun and retain the adjective from "soda pop"
People in the South do not use Coke as a generic word for pop. They use it as an example. As in "do you want a Coke or something? I think there's a couple of cans of orange." It's just like if you go into a restaurant, the waitress will ask if you would like some tea. It doesn't mean that they won't serve coffee or don't know what coffee is.
I grew up with "pop" for flavored carbonated beverages, and a "float" if there's ice cream in it. "Soda" meant club soda, as in a scotch and soda.
Title: Re: Wild & Wacky Stats!
Post by: MasterJedi on May 06, 2008, 06:52:23 AM
Yeah, looking at that map, you'd think Wisconsin and perhaps Pennsylvania would be flipped but according to http://popvssoda.com:2998/stats/ALL.html (http://popvssoda.com:2998/stats/ALL.html), nope, not the case. I wonder if they did the ole' switcharoo on accident. This study was done from Oklahoma after all.
The eastern part of the state uses the correct form, Soda, the rest of the state uses the retarded term pop. We have the most people in the east so that's how it comes out that way.
And pop is a sound, it's not something you drink.
Title: Re: Wild & Wacky Stats!
Post by: Adam Griffin on May 06, 2008, 08:56:39 AM
Pop vs. Soda vs. Coke w/ Shaded Percentage:
()
()
Title: Re: Wild & Wacky Stats!
Post by: they don't love you like i love you on May 06, 2008, 10:03:47 AM
Yeah what jimrtex described is a "float" here.
Do people in the south seriously refer to Sprite, Sierra Mist and 7 Up as "Coke"?
Do people in the south seriously refer to Sprite, Sierra Mist and 7 Up as "Coke"?
Title: Re: Wild & Wacky Stats!
Post by: Josh/Devilman88 on May 06, 2008, 10:24:07 AM
Yeah what jimrtex described is a "float" here.
Do people in the south seriously refer to Sprite, Sierra Mist and 7 Up as "Coke"?
Do people in the south seriously refer to Sprite, Sierra Mist and 7 Up as "Coke"?
I haven't talked to anyone that does.
Title: Re: Wild & Wacky Stats!
Post by: Sbane on May 06, 2008, 11:17:48 AM
I gotta say pop is the most retarded name for soda. No offense.
Title: Re: Wild & Wacky Stats!
Post by: Brittain33 on May 06, 2008, 11:54:03 AM
I doubt it's too accurate. The states with the most dry counties should have the lowest alcohol consumption rate.
Isn't that a bit like arguing that the states with the strictest abstinence-only sex ed should have the lowest teen pregnancy rates?
Title: Re: Wild & Wacky Stats!
Post by: Adam Griffin on May 06, 2008, 12:30:23 PM
Yeah what jimrtex described is a "float" here.
Do people in the south seriously refer to Sprite, Sierra Mist and 7 Up as "Coke"?
Do people in the south seriously refer to Sprite, Sierra Mist and 7 Up as "Coke"?
Not exactly. Where I live, most people ask for the specific beverage if they know what they want. For example, if we want a Sprite, we're not gonna say "Gimme a pop", "Gimme a soda", or "Gimme a coke", we'll say "Gimme a sprite". If you're at a restaurant and ask for a coke, you'll get Coca-Cola. If you're in my house and ask for a coke, you'll get the same. However, I've heard people ask them to "get me a coke" if they are at someone else's house, to which the other person asks, "What kind? We got ..." but if you're out in public, you'd ask "What kind of drinks do you have?", with no reference to pop, soda, or coke. But that's just Georgia. ;) Coca-Cola is the dominant beverage in the South and when people ask for it, it's normally what they want -- not a generalized term for beverage.
Title: Re: Wild & Wacky Stats!
Post by: Adam Griffin on May 06, 2008, 12:43:22 PM
So if you were to make a vast, vast generalization based off of this poll/study mentioned earlier and apply it to the entire U.S. population, you would have the following:
116,087,126 people (38.18%) would say 'Pop'
117,982,820 people (38.80%) would say 'Soda'
51,066,418 people (16.80%) would say 'Coke'
18,882,175 people (6.22%) would say something else
116,087,126 people (38.18%) would say 'Pop'
117,982,820 people (38.80%) would say 'Soda'
51,066,418 people (16.80%) would say 'Coke'
18,882,175 people (6.22%) would say something else
Title: Re: Wild & Wacky Stats!
Post by: Adam Griffin on May 06, 2008, 01:10:22 PM
Sexual Orientation Motivated Hate Crimes Per Capita:
()
I was actually shocked to see that the states that have the most legislation in place for the LGBT community have the highest rate of violence against them. I also would have loved to seen data for the five states omitted.
Race Related Hate Crimes Per Capita:
()
Again, rather intrigued by this one. The darker shades indicates more incidents per capita.
()
I was actually shocked to see that the states that have the most legislation in place for the LGBT community have the highest rate of violence against them. I also would have loved to seen data for the five states omitted.
Race Related Hate Crimes Per Capita:
()
Again, rather intrigued by this one. The darker shades indicates more incidents per capita.
Title: Re: Wild & Wacky Stats!
Post by: jesmo on May 06, 2008, 02:26:13 PM
Missouri is correct on what to call that beverage. In general the state is usually correct.
Title: Re: Wild & Wacky Stats!
Post by: Verily on May 06, 2008, 02:53:47 PM
Sexual Orientation Motivated Hate Crimes Per Capita:
()
I was actually shocked to see that the states that have the most legislation in place for the LGBT community have the highest rate of violence against them. I also would have loved to seen data for the five states omitted.
()
I was actually shocked to see that the states that have the most legislation in place for the LGBT community have the highest rate of violence against them. I also would have loved to seen data for the five states omitted.
As it's only crimes that were deemed to be motivated by sexual orientation by the court, it's unsurprising. There are likely plenty (I'll go out on a pretty sturdy limb and say a lot more) of such crimes in the intolerant states, but the courts don't deem them such. This might also be a factor in the race-related crimes statistics, although much less of one (and, in both cases, it depends heavily on state statutes defining hate crimes).
Title: Re: Wild & Wacky Stats!
Post by: Ban my account ffs! on May 06, 2008, 03:21:02 PM
Sexual Orientation Motivated Hate Crimes Per Capita:
()
I was actually shocked to see that the states that have the most legislation in place for the LGBT community have the highest rate of violence against them. I also would have loved to seen data for the five states omitted.
()
I was actually shocked to see that the states that have the most legislation in place for the LGBT community have the highest rate of violence against them. I also would have loved to seen data for the five states omitted.
As it's only crimes that were deemed to be motivated by sexual orientation by the court, it's unsurprising. There are likely plenty (I'll go out on a pretty sturdy limb and say a lot more) of such crimes in the intolerant states, but the courts don't deem them such. This might also be a factor in the race-related crimes statistics, although much less of one (and, in both cases, it depends heavily on state statutes defining hate crimes).
That map says nothing about how tolerant the various states are, but instead really reflects on how confident gays and lesbians feel in pursuing charges against their aggressors.
Title: Re: Wild & Wacky Stats!
Post by: Adam Griffin on May 07, 2008, 02:20:17 PM
Cancer diagnoses per 100,000:
()
Cancer deaths per 100,000:
()
()
Cancer deaths per 100,000:
()
Title: Re: Wild & Wacky Stats!
Post by: Verily on May 07, 2008, 02:46:48 PM
So the moral is don't go to Arkansas for cancer treatment.
Title: Re: Wild & Wacky Stats!
Post by: dead0man on May 08, 2008, 06:35:44 AM
So what do you call a soda? (ie scoop of ice cream in a glass of pop)
Title: Re: Wild & Wacky Stats!
Post by: dead0man on May 08, 2008, 06:43:58 AM
Yeah what jimrtex described is a "float" here.
Do people in the south seriously refer to Sprite, Sierra Mist and 7 Up as "Coke"?
Do people in the south seriously refer to Sprite, Sierra Mist and 7 Up as "Coke"?
Not exactly. Where I live, most people ask for the specific beverage if they know what they want. For example, if we want a Sprite, we're not gonna say "Gimme a pop", "Gimme a soda", or "Gimme a coke", we'll say "Gimme a sprite". If you're at a restaurant and ask for a coke, you'll get Coca-Cola. If you're in my house and ask for a coke, you'll get the same. However, I've heard people ask them to "get me a coke" if they are at someone else's house, to which the other person asks, "What kind? We got ..." but if you're out in public, you'd ask "What kind of drinks do you have?", with no reference to pop, soda, or coke. But that's just Georgia. ;) Coca-Cola is the dominant beverage in the South and when people ask for it, it's normally what they want -- not a generalized term for beverage.
But then why do you guys answer the question with "Coke" then?
Poll : Do you call it soda or pop?
Everybody in the South : We call it Coke!
The rest of the country : wait, what? You call Sprite or Dr.Pepper "Coke"?
South : no that would be stupid.
The rest of us : ba wha?
Title: Re: Wild & Wacky Stats!
Post by: Adam Griffin on May 08, 2008, 07:27:12 AM
Yeah what jimrtex described is a "float" here.
Do people in the south seriously refer to Sprite, Sierra Mist and 7 Up as "Coke"?
Do people in the south seriously refer to Sprite, Sierra Mist and 7 Up as "Coke"?
Not exactly. Where I live, most people ask for the specific beverage if they know what they want. For example, if we want a Sprite, we're not gonna say "Gimme a pop", "Gimme a soda", or "Gimme a coke", we'll say "Gimme a sprite". If you're at a restaurant and ask for a coke, you'll get Coca-Cola. If you're in my house and ask for a coke, you'll get the same. However, I've heard people ask them to "get me a coke" if they are at someone else's house, to which the other person asks, "What kind? We got ..." but if you're out in public, you'd ask "What kind of drinks do you have?", with no reference to pop, soda, or coke. But that's just Georgia. ;) Coca-Cola is the dominant beverage in the South and when people ask for it, it's normally what they want -- not a generalized term for beverage.
But then why do you guys answer the question with "Coke" then?
Poll : Do you call it soda or pop?
Everybody in the South : We call it Coke!
The rest of the country : wait, what? You call Sprite or Dr.Pepper "Coke"?
South : no that would be stupid.
The rest of us : ba wha?
Yeah I know, it's dumb. I guess it's just a preferred term compared to 'pop' or 'soda', or it may have to do with the fact that Coca-Cola is based in Atlanta and the term just infiltrated the region because of that.
Title: Re: Wild & Wacky Stats!
Post by: HappyWarrior on May 08, 2008, 08:19:06 AM
Yeah what jimrtex described is a "float" here.
Do people in the south seriously refer to Sprite, Sierra Mist and 7 Up as "Coke"?
Do people in the south seriously refer to Sprite, Sierra Mist and 7 Up as "Coke"?
Not exactly. Where I live, most people ask for the specific beverage if they know what they want. For example, if we want a Sprite, we're not gonna say "Gimme a pop", "Gimme a soda", or "Gimme a coke", we'll say "Gimme a sprite". If you're at a restaurant and ask for a coke, you'll get Coca-Cola. If you're in my house and ask for a coke, you'll get the same. However, I've heard people ask them to "get me a coke" if they are at someone else's house, to which the other person asks, "What kind? We got ..." but if you're out in public, you'd ask "What kind of drinks do you have?", with no reference to pop, soda, or coke. But that's just Georgia. ;) Coca-Cola is the dominant beverage in the South and when people ask for it, it's normally what they want -- not a generalized term for beverage.
But then why do you guys answer the question with "Coke" then?
Poll : Do you call it soda or pop?
Everybody in the South : We call it Coke!
The rest of the country : wait, what? You call Sprite or Dr.Pepper "Coke"?
South : no that would be stupid.
The rest of us : ba wha?
Its because theres a special kind of coke inside :-D
Title: Re: Wild & Wacky Stats!
Post by: jimrtex on May 08, 2008, 10:34:51 AM
Yeah what jimrtex described is a "float" here.
Do people in the south seriously refer toSprite, Sierra Mist and 7 Up as "Coke"?
Do people in the south seriously refer to
Title: Re: Wild & Wacky Stats!
Post by: Willy Woz on May 09, 2008, 10:48:30 PM
I doubt it's too accurate. The states with the most dry counties should have the lowest alcohol consumption rate.
Isn't that a bit like arguing that the states with the strictest abstinence-only sex ed should have the lowest teen pregnancy rates?
No. The high teen pregnancy rates in the South are because of lack of contraception, not higher sexual activity. The states with a high rate of dry counties may have the highest occurence of moonshining, bathtub gin, etc. ...but certainly not the highest rate of drinking.