PredictionsMock2012 Presidential Election Polls - IL ResultsPolls
Note: The Google advertisement links below may advocate political positions that this site does not endorse.
Illinois Polls (Aggregate = Strong Obama for 3-poll average)National Summary
Candidate Party Avg. #Wins EV Poll Graph
Obama Democratic 57% 3 20pie
Romney Republican 39% 0 0
Other - 0% 0 0
-Undecided- 4% 0 0

 Three-Poll Rolling Average
 Rolling Average Poll Graph

DatePoll Source Spread Romney Obama OtherUnd M.O.E. Sample#C
2012-11-03YouGovO +1938%57%0%5%4%1,126 L0
2012-10-30We Ask AmericaO +1641%57%0%2%3%1,198 L0
2012-10-11YouGovO +2038%58%0%4%4%850 L0
2012-10-08Market Shares Corp.O +1936%55%0%9%4%700 L0
2012-09-14YouGovO +2336%59%2%3%4%1,068 L0
2012-09-10Southern Illinois UniversityO +1433%47%3%16%3%1,261 R0
2012-09-05We Ask AmericaO +1737%54%3%6%3%1,382 L0
2012-07-22IpsosO +2031%51%4%14%4%600 R0
2012-02-06Market Shares Corp.O +2135%56%0%9%4%600 R0
2011-10-16Southern Illinois UniversityO +1234%46%0%20%3%1,000 R0
2011-09-28We Ask AmericaO +1535%50%0%15%2%1,815 R0


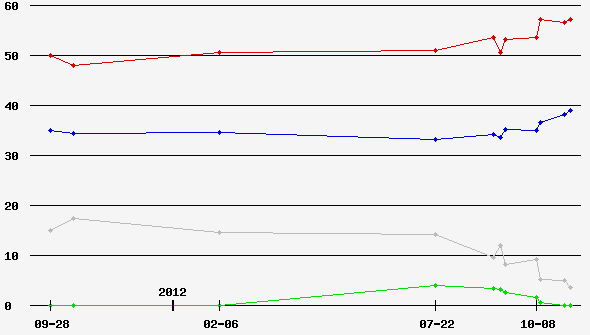
Back to 2012 Presidential Polls Home - Polls Home


Terms of Use - DCMA Policy - Privacy Policy and Cookies

© Dave Leip's Atlas of U.S. Elections, LLC 2019 All Rights Reserved