


|
Date of Prediction: 2010-10-28 Version:44
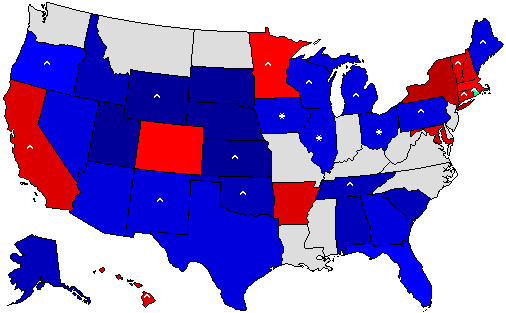
Prediction Map
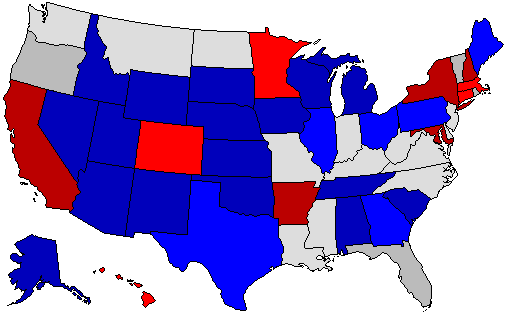
* = Pickup via defeat of incumbent; ^ = Pickup of an open seat Confidence Map
Prediction States Won
Confidence States Won
State Pick-ups
Prediction Score (max Score = 74)
Analysis
No Analysis Entered
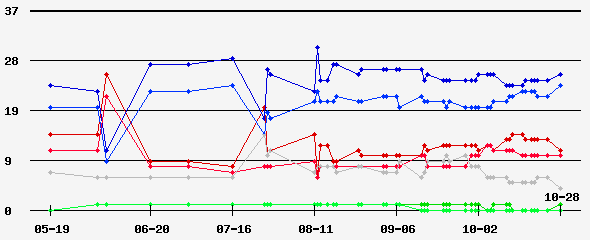
Prediction History
Comments History
- hide
Version: 25 Updating California. With two new polls showing a tie or a slight Brown lead. Version: 8 Back to reality from the last version...This is where I believe the races to be if the election were held today. Version: 7 Death to the Tea Party...Gubernatorial Addition. Version: 6 California: Updated to show a slight Whitman lead. Whitman has been outspending her democratic opponent Former Governor Jerry Brown. However, I still give an edge to Brown come the fall campaign. If Whitman were to pull it off it would be very close due to California demographics. She will have to buy every vote she recieves. Version: 3 Best Case Landslide Scenario for Democratic pickup opportunities. This map will likely *not* happen in the fall but simply illustrates a best case scenario.
Version History Member Comments User's Predictions
Links
|
||||||||||||||||||||||||||||||||||||||||||||||||||||||||||||||||||||||||||||||||||||||||||||||||||||||||||||||||||||||||||||||||||||||||||||||||||||||||||||||||||||||||||||||||||||||||||||||||||||||||||||||||||||||||||||||||||||||||||||||||||||||||||||||||||||||||||||||||||||||||||||||||||||||||||||||||||||||||||||||||||||||||||||||||||||||||||||||||||||||||||||||||||||||||||||||||||||||||||||||||||||||||||||||
 2024 President
 2022 Senate
 2022 Governor
 2020 President
 2020 Senate
 2020 Governor
 2018 Senate
 2018 Governor
 2016 President
 2016 Senate
 2016 Governor
 2014 Senate
 2014 Governor
 2012 President
 2012 Senate
 2012 Governor
 2012 Rep Primary
 2010 Senate
 2010 Governor
 2008 President
 2008 Senate
 2008 Governor
 2008 Dem Primary
 2008 Rep Primary


Back to 2010 Gubernatorial Prediction Home - Predictions Home