


|
Date of Prediction: 2008-11-03 Version:13
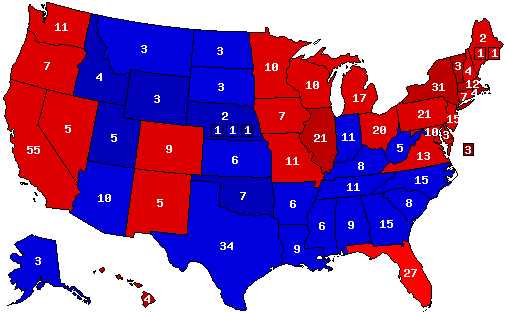
Prediction Map
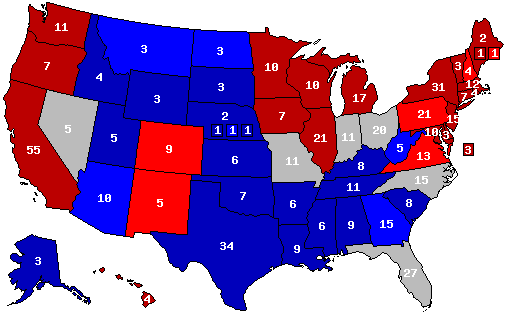
Confidence Map
Prediction States Won
Confidence States Won
State Pick-ups
Prediction Score (max Score = 112)
Analysis
No Analysis Entered
Prediction History
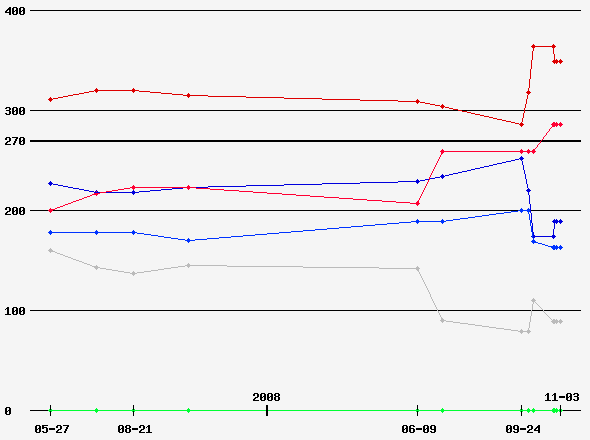
Comments History
- hide
Version: 7 Probably time to update this. Version: 6 I'm changing Michigan, Pennsylvania, New Hampshire and Wisconsin to Lean Obama, as McCain hasn't led any polls in them in months. I'm also flipping Nevada to McCain, but downgrading Montana to Lean. Version: 4 Changes: Version: 3 KY - I doubt that new SUSA poll is right, but something is up here. I'll put it at Lean R, a Democrat winning it is POSSIBLE at least. Version: 2 Just tweaking things a bit. Version: 1 Not that this means anything at the current time.
Version History Member Comments User's Predictions
Links
|
||||||||||||||||||||||||||||||||||||||||||||||||||||||||||||||||||||||||||||||||||||||||||||||||||||||||||||||||||||||||||||||||||||||||||||||||||||||||||||||||||||||||||||||||||||||||||||||||||||||||||||||||||||||||||||||||||||||||||||||||||||||||||||||||||||||||||||||||||||||||||||||||||||||||||||||||||||||||||||||||||||||||||||||||||||||||||||||||||||||||||||||||||||||||||||||||||||||||||||||||||||||||||||||||||||||||||||||||||||||||||||||||||||||||||||||||||||||||||||||||||
 2023 Governor
 2022 Senate
 2022 Governor
 2021 Governor
 2020 President
 2020 Senate
 2020 Governor
 2018 Senate
 2018 Governor
 2016 President
 2016 Senate
 2016 Governor
 2015 Governor
 2014 Senate
 2014 Governor
 2013 Governor
 2012 President
 2012 Senate
 2012 Governor
 2012 Rep Primary
 2010 Senate
 2010 Governor
 2009 Governor
 2008 President
 2008 Senate
 2008 Governor
 2008 Dem Primary
 2008 Rep Primary
 2007 Governor
 2006 U.S. Senate
 2006 Governor
 2004 President
Back to 2008 Presidential Prediction Home - Predictions Home