PredictionsMock2008 Presidential Predictions - AntonioV (D-CA) ResultsPolls
Note: The Google advertisement links below may advocate political positions that this site does not endorse.
Date of Prediction: 2008-11-04 Version:9

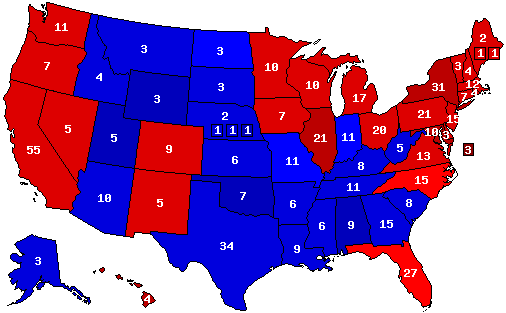
Prediction Map
AntonioV MapPrediction Key

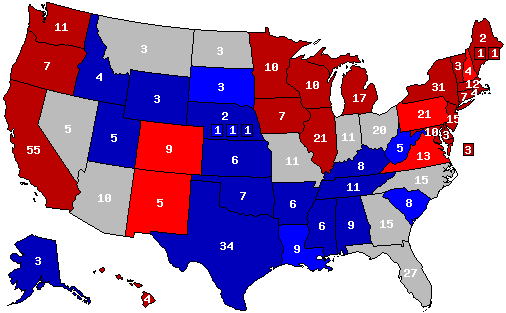
Confidence Map
AntonioV MapConfidence Key

Prediction States Won
270 |
538 |
pie
Dem353
 
Rep185
 
Ind0


Confidence States Won
270 |
538 |
pie
Dem286
 
Rep132
 
Ind0
 
Tos120
 

State Pick-ups

Gain Loss Hold Net Gain
ST CD EV ST CD EV ST CD EV
Dem+80+101000202252+101
Rep000-80-101233185-101
Ind0000000000


Prediction Score (max Score = 112)

ScoreState WinsState PercentagesCD WinsCD Percentages
99504243
piepiepiepiepie

Analysis
No Analysis Entered

Prediction History
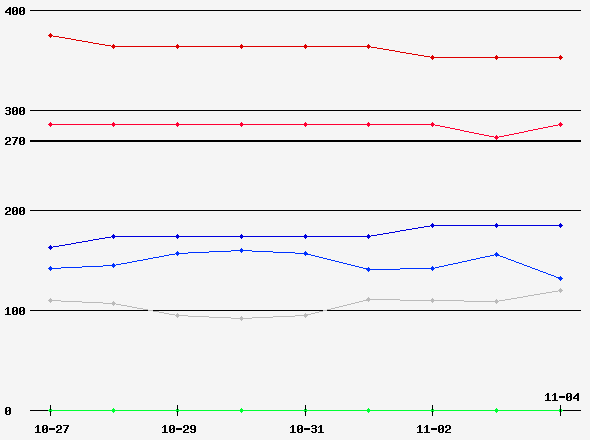
Prediction Graph


Comments History - show

Version History


Member Comments
 By: AntonioV (D-CA) 2008-11-07 @ 12:13:55
So my prediction was right for 50 of 51 sates ( Obama wins Indiana ! :D ).
Thanks to fivethirtyeight.com for it's projections.

Last Edit: 2008-11-07 @ 12:57:31
prediction Map

 By: AntonioV (D-CA) 2008-12-21 @ 04:21:49
81,1%...
That's not a bad score ! :)
prediction Map

 By: FrenchEd (D-NJ) 2008-12-22 @ 16:56:59
Especially if you consider that it should be divided by 112 and not 122 (give it a try...). So it should be, off the top of my head, more like 88%.prediction Map

 By: AntonioV (D-CA) 2008-12-27 @ 08:08:40
That's true. 51 States and 5 districts. So I have 88,4%.
But why is the score divided by 122 instead of 112 ?

Last Edit: 2008-12-27 @ 08:13:18
prediction Map

 By: FrenchEd (D-NJ) 2009-01-02 @ 14:00:40
Because the website administrator knows more about politics than about maths...
:-)
prediction Map

 By: AntonioV (D-CA) 2009-01-03 @ 04:34:13
Ok, thanks. :)prediction Map


User's Predictions

Prediction Score States Percent Total Accuracy Ver #D Rank#Pred
P 2022 Senate 33/35 26/35 59/70 84.3% pie 6 0 69T305
P 2022 Governor 34/36 27/36 61/72 84.7% pie 6 0 51T272
P 2020 President 53/56 36/56 89/112 79.5% pie 13 5 434T684
P 2020 Senate 32/35 18/35 50/70 71.4% pie 8 3 274T423
P 2020 Governor 11/11 8/11 19/22 86.4% pie 1 5 10T293
P 2019 Governor 2/3 2/3 4/6 66.7% pie 1 4 35T192
P 2018 Senate 33/35 24/35 57/70 81.4% pie 14 0 24T483
P 2018 Governor 32/36 28/36 60/72 83.3% pie 7 2 18T372
P 2016 President 50/56 30/56 80/112 71.4% pie 18 0 246T678
P 2016 Senate 31/34 21/34 52/68 76.5% pie 18 0 35T362
P 2016 Governor 9/12 5/12 14/24 58.3% pie 6 0 67T279
P 2014 Senate 34/36 27/36 61/72 84.7% pie 8 0 13T382
P 2014 Governor 31/36 18/36 49/72 68.1% pie 5 0 56T300
P 2013 Governor 2/2 1/2 3/4 75.0% pie 2 24 17T153
P 2012 President 56/56 48/56 104/112 92.9% pie 15 0 13T760
P 2012 Senate 31/33 19/33 50/66 75.8% pie 11 0 111T343
P 2012 Governor 11/11 7/11 18/22 81.8% pie 2 31 24T228
P 2012 Rep Primary 44/52 23/52 67/104 64.4% pie 27 - 16T231
P 2010 Senate 34/37 28/37 62/74 83.8% pie 19 0 21T456
P 2010 Governor 35/37 24/37 59/74 79.7% pie 10 0 59T312
P 2009 Governor 1/2 0/2 1/4 25.0% pie 1 12 92T103
P 2008 President 54/56 45/56 99/112 88.4% pie 9 0 26T1,505
P 2008 Senate 33/33 27/33 60/66 90.9% pie 5 0 1T407
P 2008 Governor 10/11 4/11 14/22 63.6% pie 1 5 212T264
Aggregate Predictions 696/751 496/751 1192/1502 79.4% pie


Back to 2008 Presidential Prediction Home - Predictions Home


Terms of Use - DCMA Policy - Privacy Policy and Cookies

© Dave Leip's Atlas of U.S. Elections, LLC 2019 All Rights Reserved