


|
Date of Prediction: 2008-11-04 Version:8
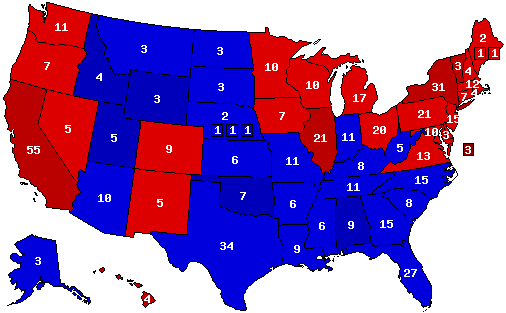
Prediction Map
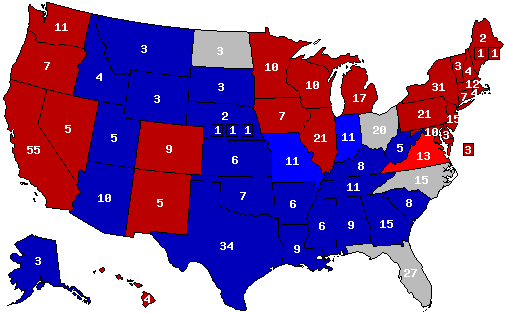
Confidence Map
Prediction States Won
Confidence States Won
State Pick-ups
Prediction Score (max Score = 112)
Analysis
No Analysis Entered
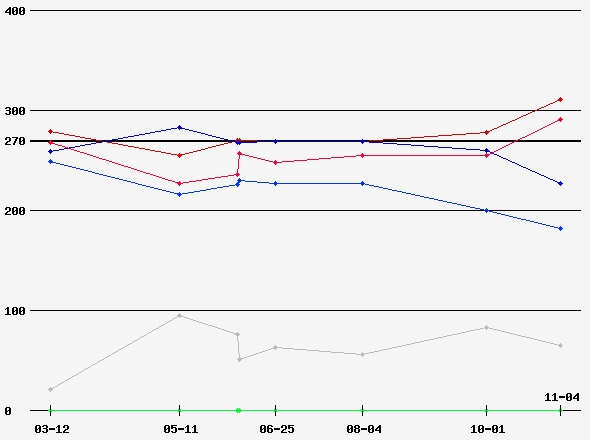
Prediction History
Comments History
- hide
Version: 7 I have long thought and said that the nationwide contest theorized by many (in view, for one, of the nature of the two major party candidates, each of whom has a good deal of crossover appeal) would fail to materialize—-my pre-primaries sense was that none but CO, NM, NV, IA, NH and OH was a candidate to vote other than as it did in 2004, and that belief persisted even after the nominations were finalized--and these predictions reflect that this election, unless Palin should show so poorly in the VP debate and thereafter as to scare uncommitteds and push them into Obama-Biden camp, such that the Democratic ticket might reach the low 300s in electoral votes and top 52 per cent in the popular vote, will turn on those states that were amongst the closest in 2000 and 2004. NM and IA will most probably be, as they were in 2000, in the Democratic camp and NH is likely to go blue (or, under this scheme, red) once more; Obama must be considered the more-than-slight favorite in CO as well. Nevada is as difficult to predict as is any state, and Ohio is, well, Ohio. Version: 3 Obama-McCain; decided, as much as by anything, by Nebraska's first congressional district. I can't think of much we political junkies would enjoy more than such an odd result. Version: 2 Assumes, for the first time, Obama as Democratic nominee (perhaps evidencing that I, a Clinton loyalist, have bought into the argument that Obama will have considerable difficulty winning what in what is, at least theoretically [generically], an atmosphere that lends itself to a firm victory for the Democratic candidate; I don't see, in the end, that he can secure enough states that went for Bush in 2004 to offset the loss of Ohio [which might, to be sure, find itself in the Obama column in a future projection, not least because I'm not at all certain that McCain will run a competent campaign], and I imagine that should a Democratic candidate win, it will be because the election will have transpired roughly as those of 2000 and 2004 did, with the provision that Ohio will have found itself in the "D" column).
Version History Member Comments User's Predictions
Links
|
||||||||||||||||||||||||||||||||||||||||||||||||||||||||||||||||||||||||||||||||||||||||||||||||||||||||||||||||||||||||||||||||||||||||||||||||||||||||||||||||||||||||||||||||||||||||||||||||||||||||||||||||||||||||||||||||||||||||||||||||||||||||||||||||||||||||||||||||||||||||||||||||||||||||||||||||||||||||||||||||||||||||||||||||||||||||||||||||||||||||||||||||||||||||||||||||||||||||||||||||||||||||||||||||||||||||||||||||||||||
 2024 President
 2023 Governor
 2022 Senate
 2022 Governor
 2021 Governor
 2020 President
 2020 Senate
 2020 Governor
 2019 Governor
 2018 Senate
 2018 Governor
 2017 Governor
 2016 President
 2016 Senate
 2016 Governor
 2015 Governor
 2014 Senate
 2014 Governor
 2012 President
 2012 Senate
 2012 Governor
 2012 Rep Primary
 2010 Senate
 2010 Governor
 2009 Governor
 2008 President
 2008 Senate
 2008 Governor
Back to 2008 Presidential Prediction Home - Predictions Home