Analysis
Please read all of my analysis before commenting!
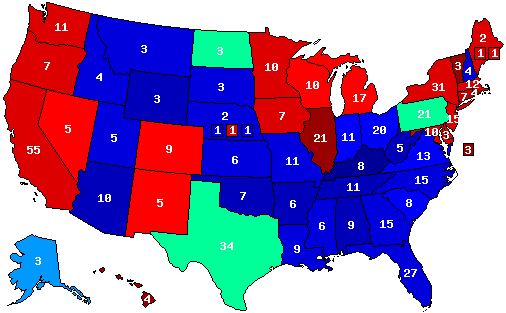
This is an Obama / McCain matchup, but ---
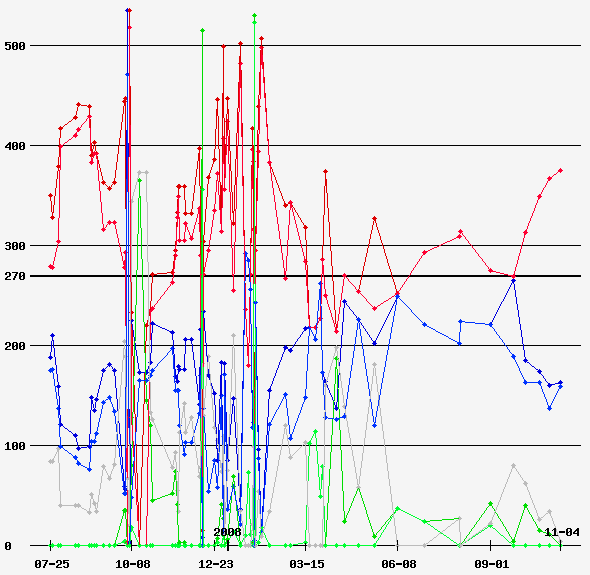
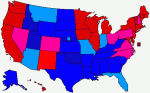
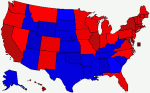
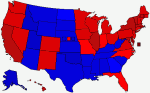
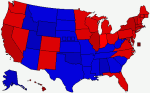
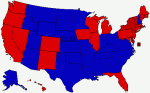
as promised, here is my map based solely on the numbers from the second poll average convergence, from March to the end of April 2008, which I have now completed. I have combed through the polling data for all 50 states, including the 65 updates for the month of April. Out of the 341 polls I have studied, 159 of them fall within the time frame from March to the end of April 2008.
You can see every single poll number, with links to every pollster, and the averages and much more here at my blog. It would not be practical to post all of this data here for it would make this page far too long to be enjoyable, so stop by and check out the numbers at the link provided.
Before proceeding, please remember that this map is not based on intuition or feeling or personal bias. It is based strictly on the numbers and uses exactly the same methodology as the first poll convergence.
The percentages predictions are a little different. They are a reflection of the margin averages for each state:
Up to 1% - green, 30%
2%-5% - respective color, 40%
5%-13%- respective color, 50%
14%-24%-respective color, 60%
25% and above- respective color, 70%
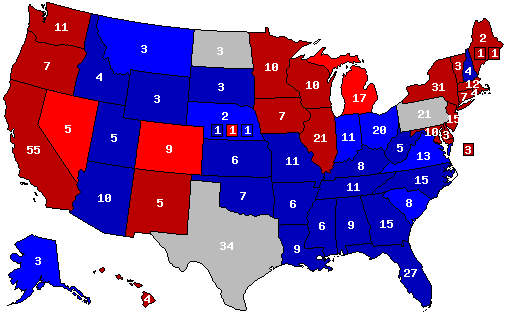
There are currently three tossup states:
PA, with McCain at +0.70% margin*
ND, with McCain at +1.00% margin**
TX, with McCain at +1.00% margin***
*note: PA has been polled more than any other state in the union. for this time frame, there are 11 polls. The normal average of polls is 6 or 7. Alone in April there are 9 polls. Were I to take a snapshot of April only for PA, then Obama would be in the lead, but with only +0.30%. I am writing this only to illustrate how incredibly tight this one race is.
**Before anyone should decide to complain about ND, go to my blog and read the numbers first. There are two polls for this state, one with Obama ahead by 4, the next with McCain ahead by 6. Both have both candidates in the low 40s or high 30s and there are lots of undecideds. The principle is this: if a poll is an outlier, then successive polls will show us this. But with only one other poll with just as close a margin as the first poll, it is impossible to decide which poll would be an outlier. So, the average is indeed McCain +1.0, which makes the state currently a battleground. Do I think this state will be a battleground? No, probably not. But I am bound to present the numbers exactly as they are.
***TX: there has only been one poll, with only 1 point between McCain and Obama. I am surprised that no polling organization took the time to poll TX in April.
Now, some can claim that two months is a long time. Well, the first convergence covered three months, but there were less polls then, the pace of polling has picked-up since then and will accelerate toward November, but either way, I find such a time frame to be more than appropriate, for polls have their own ebb and flow and if you watch them long enough, you can start to see the pattern. Time and time again I have done calculations for two months as opposed to one and come up with almost the same results, and I am talking about contested states here.
If I were to make a complaint, it would be about the low number of nationally recognized pollsters doing state by state match-ups. SUSA and Rasmussen do the bulk of this work. It would be good to see three or four more reputable pollsters doing state-by-state matchups every month. It would provide a larger and healthier numbers pool.
The first posting here will be the polling table with a legend to know how to interpret it, plus some commentary.
---------------------
And a final note: I am a person very receptive to adult discussion and also agressive debate, but verbal attacks, insults, use of deragatory terms toward candidates et al... is just not kosher here. Please don't do it. When you read this analysis and also the first post, you will notice that I am sticking completely to the facts, nothing more and nothing less.
So keep it sane, keep it sanguine, keep it adult. Thanks.


 2014 Senate
 2012 President
 2010 Senate
 2008 President
 2008 Senate
 2008 Dem Primary
 2008 Rep Primary