


|
Date of Prediction: 2008-06-03 Version:15
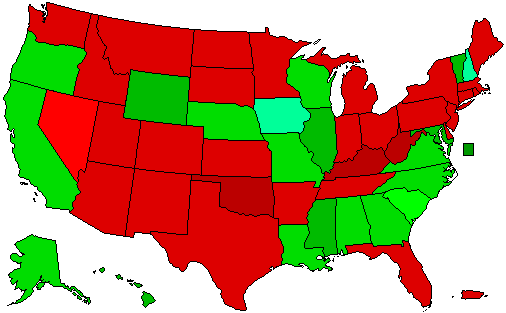
Prediction Map
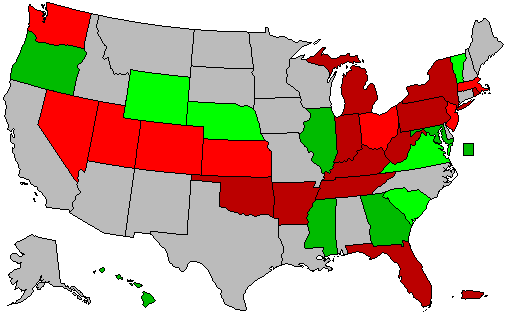
Confidence Map
Prediction States Won
Confidence States Won
Prediction Score (max Score = 104)
Analysis
I'm a little bit pissed that I changed my Puerto Rico analysis a few days ago based on the premise that there was going to be a caucus in the middle of June and that's what the points would be based on...and then the site used the primary. So just for the record...I knew that Hillary Clinton was going to get more than 60% in the primary. I just adjusted to show a smaller win for a caucus later in June cause I figure at that point her candidacy would be suspended and she wouldn't win by as much. And I think that if the administrator realized that the numbers used were going to be those of the primary, and not some future caucus...then he REALLY should have changed the dates on the site before predictions were taken down so we knew what he was talking about before he started taking away points. That's all. FUCKING LAME.
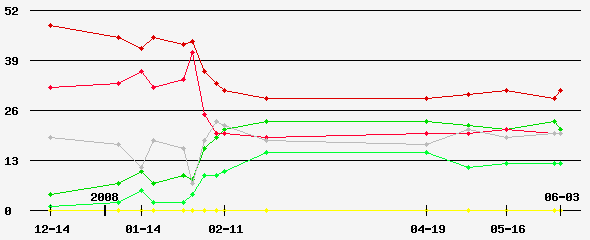
Prediction History
Comments History
- show
Version History Member Comments User's Predictions
Links
|
|||||||||||||||||||||||||||||||||||||||||||||||||||||||||||||||||||||||||||||||||||||||||||||||||||||||||||||||||||||||||||||||||||||||||||||||||||||||||||||||||||||||||||||||||||||||||||||||||||||||||||||||||||||||||||||||||||||||||||||||||||||||||||||||||||||||||||||||||||||||||||||||||||||||||||||||||||||||||||||||||||||||||||||||||||||||||||||||||||||||||||||||||||||||||||||||||||||||||||||||||||||||||||||||||||||||||||||||||||||||||||||||||||||||||||||||||||||||||||||||||
 2024 President
 2023 Governor
 2022 Senate
 2022 Governor
 2021 Governor
 2020 President
 2020 Senate
 2020 Governor
 2019 Governor
 2018 Senate
 2018 Governor
 2017 Governor
 2016 President
 2016 Senate
 2016 Governor
 2015 Governor
 2014 Senate
 2014 Governor
 2013 Governor
 2012 President
 2012 Senate
 2012 Governor
 2012 Rep Primary
 2011 Governor
 2010 Senate
 2010 Governor
 2009 Governor
 2008 President
 2008 Senate
 2008 Governor
 2008 Dem Primary
 2008 Rep Primary
 2007 Governor
 2006 U.S. Senate
 2006 Governor
 2004 President
Back to 2008 Dem Presidential Primary Prediction Home - Predictions Home