


|
Date of Prediction: 2008-05-20 Version:16
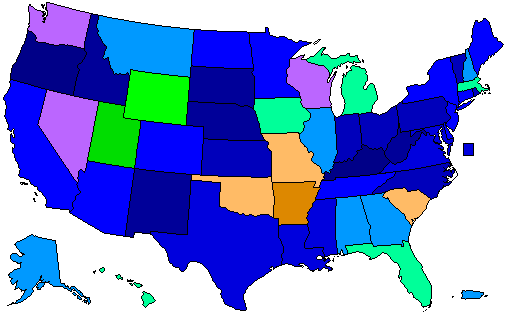
Prediction Map
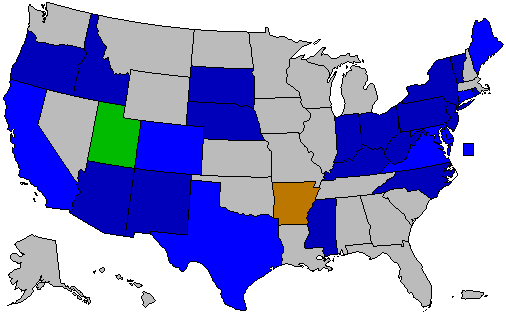
Confidence Map
Prediction States Won
Confidence States Won
Prediction Score (max Score = 104)
Analysis
No Analysis Entered
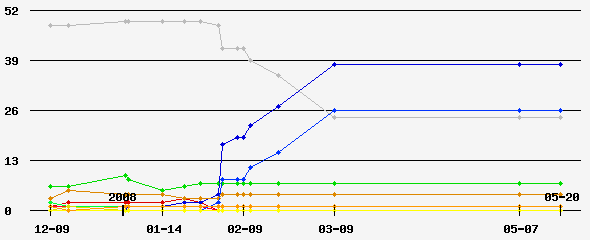
Prediction History
Comments History
- hide
Version: 7 Last minute flipping of Florida to Romney. Version: 6 I'll go out on a limb a bit and say Giuliani DOES get Florida. Version: 5 Just a little tweaking. Version: 4 OK, I'll give NH to McCain for now, but let's wait and see what the polls say. Version: 3 I'm flipping Iowa back to Romney and changing NH to a tossup, although I still say Romney has a slight advantage there and it'll probably go back to Lean if he does win Iowa. Also fixed my error and did give Arkansas to Huckabee and Utah to Romney. I did a few more states too although this is certainly subject to change. Version: 2 I'm willing to go a bit further out on a limb. Still too early to make guesses on most though. Version: 1 That's as far as I'll go for now.
Version History Member Comments User's Predictions
Links
|
|||||||||||||||||||||||||||||||||||||||||||||||||||||||||||||||||||||||||||||||||||||||||||||||||||||||||||||||||||||||||||||||||||||||||||||||||||||||||||||||||||||||||||||||||||||||||||||||||||||||||||||||||||||||||||||||||||||||||||||||||||||||||||||||||||||||||||||||||||||||||||||||||||||||||||||||||||||||||||||||||||||||||||||||||||||||||||||||||||||||||||||||||||||||||||||||||||||||||||||||||||||||||||||||||||||||||||||||||||||||||||||
 2023 Governor
 2022 Senate
 2022 Governor
 2021 Governor
 2020 President
 2020 Senate
 2020 Governor
 2018 Senate
 2018 Governor
 2016 President
 2016 Senate
 2016 Governor
 2015 Governor
 2014 Senate
 2014 Governor
 2013 Governor
 2012 President
 2012 Senate
 2012 Governor
 2012 Rep Primary
 2010 Senate
 2010 Governor
 2009 Governor
 2008 President
 2008 Senate
 2008 Governor
 2008 Dem Primary
 2008 Rep Primary
 2007 Governor
 2006 U.S. Senate
 2006 Governor
 2004 President
Back to 2008 Rep Presidential Primary Prediction Home - Predictions Home