


|
Date of Prediction: 2012-04-09 Version:15
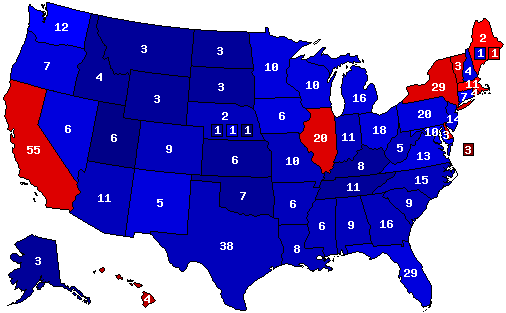
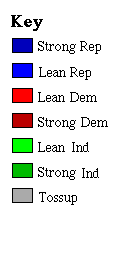
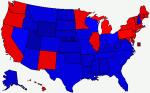
Prediction Map
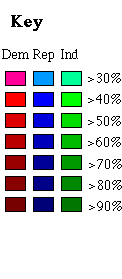
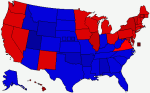
Confidence Map
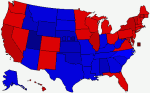
Prediction States Won
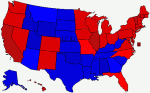
Confidence States Won
State Pick-ups
Analysis
First of all before we get all out of whack, I acknowledge this is a very long shot map. Representing the Republican party would be Gov. Mitt Romney and Rep. Paul Ryan (my best guess so far after Ryan's endorsement of Romney before Wisconsin primary). President Obama will keep Joe Biden on the ticket. Now at first glance this map looks a little skewed but lets remember its the economy stupid. If Social issues were the hot button this year Rick Santorum would be the GOP nominee, but he's not going to be because this is not like 2000 or 2004. People are out of luck and looking for solutions. The president came in on the youth, black, and yuppie vote. Romney will win the yuppie suburban vote (it's his strength at least in the primaries). Obama will still win the black vote, but less black people will come out to the polls than in 2008 because this is not a "historical" election. The youth turnout will be even lower than the black turnout and here Republicans and other 3rd parties will splinter the vote, making it much less of a prize than in '08. Obama's only real accomplishments are in foreign policy and they are valence issues not position issues. This year is about solutions, not abstract ideals. Its way to early to call the race but I just don't see the president pulling this one off with unemployment almost as high as the gas prices. Am I 100% sure this will be the map in november? No. Is Mitt Romney going to beat Barrack Obama? Yes.
Prediction History
Comments History
- hide
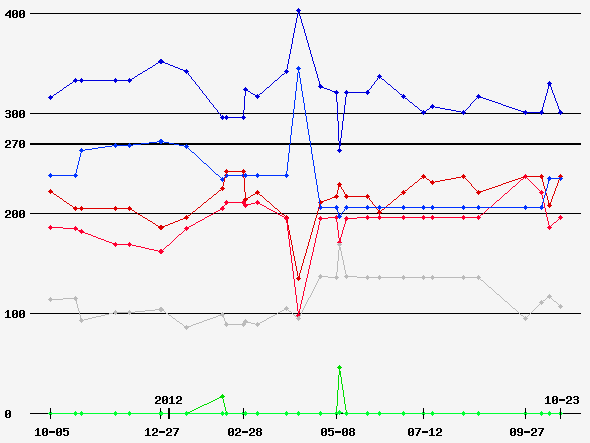
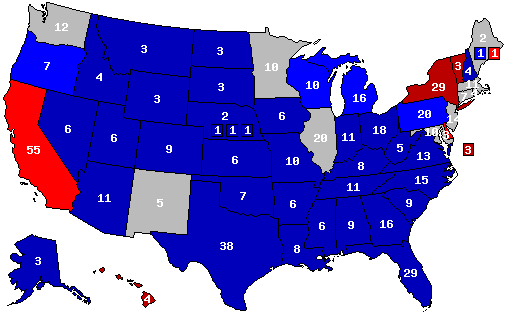
Version: 29 Romney is on the rise post debate. Version: 28 Post Debate Map - I think the momentum of the race is really starting to change now that the electorate is starting to see Romney through a more sympathetic light. Version: 25 Romney Ryan vs Obama Biden. Version: 24 Wisconsin to Obama and Michigan to Romney. Version: 18 R: Romney, McDonnell Version: 16 A more realistic map. Best case scenario for Romney: win all the tossups and lean dems. Best case Obama: win all the tossups. Version: 15 First of all before we get all out of whack, I acknowledge this is a very long shot map. Representing the Republican party would be Gov. Mitt Romney and Rep. Paul Ryan (my best guess so far after Ryan's endorsement of Romney before Wisconsin primary). President Obama will keep Joe Biden on the ticket. Now at first glance this map looks a little skewed but lets remember its the economy stupid. If Social issues were the hot button this year Rick Santorum would be the GOP nominee, but he's not going to be because this is not like 2000 or 2004. People are out of luck and looking for solutions. The president came in on the youth, black, and yuppie vote. Romney will win the yuppie suburban vote (it's his strength at least in the primaries). Obama will still win the black vote, but less black people will come out to the polls than in 2008 because this is not a "historical" election. The youth turnout will be even lower than the black turnout and here Republicans and other 3rd parties will splinter the vote, making it much less of a prize than in '08. Obama's only real accomplishments are in foreign policy and they are valence issues not position issues. This year is about solutions, not abstract ideals. Its way to early to call the race but I just don't see the president pulling this one off with unemployment almost as high as the gas prices. Am I 100% sure this will be the map in november? No. Is Mitt Romney going to beat Barrack Obama? Yes. Version: 11 Romney V Obama. Moderate turnout for the GOP. Terrible turnout for Obama, especially with young voters who carried him to victory in '08. Ron Paul is the new flavor of the week. Turnout is down also with blacks who don't show up like they did in '08 costing Obama the states of NC, VA, and FL. The Dems' hold on unions begins to further slide, costing them OH. PA is a true tossup much like OH was in '04 and in the end the Dems win it with less than a percentage point. Who knows, if the GOP can really rally around a relatively undamaged candidate PA, WI, MI, & ME could flip also. Version: 9 Red - Carried by Obama. Version: 8 Romney V Obama. It's the economy stupid. Version: 2 Romney v Obama
Version History Member Comments
User's Predictions
User Info
Links
|
||||||||||||||||||||||||||||||||||||||||||||||||||||||||||||||||||||||||||||||||||||||||||||||||||||||||||||||||||||||||||||||||||||||||||||||||||||||||||||||||||||||||||||||||||||||||||||||||||||||||||||||||||||||||||||||||||||||||||||||||||||||||||||||||||||||||||||||||||||||||||||||||||||||||||||||||||||||||||||||||||||||||||||||||||||||||||||||||||||||||||||||||||||||||||||||||||||||||||||||||||||||||


 2024 President
 2023 Governor
 2022 Senate
 2022 Governor
 2021 Governor
 2020 President
 2020 Senate
 2020 Governor
 2019 Governor
 2018 Senate
 2018 Governor
 2017 Governor
 2016 President
 2016 Senate
 2016 Governor
 2015 Governor
 2014 Senate
 2014 Governor
 2013 Governor
 2012 President
 2012 Senate
 2012 Governor
 2012 Rep Primary
 2010 Senate
 2010 Governor


Back to 2012 Presidential Prediction Home - Predictions Home