


|
Date of Prediction: 2012-10-05 Version:10
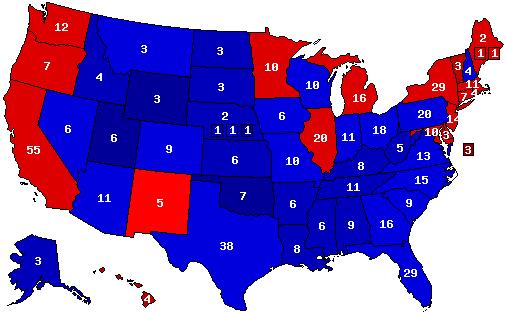
Prediction Map
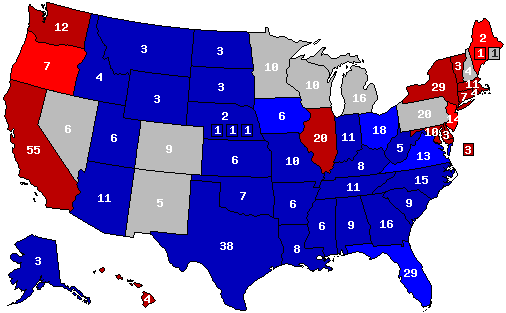
Confidence Map
Prediction States Won
Confidence States Won
State Pick-ups
Analysis
Changes favoring GOP: OK and WY from R > 60 to R > 70; WV from R > 50 to R > 60; Iowa from toss-up to leans GOP.
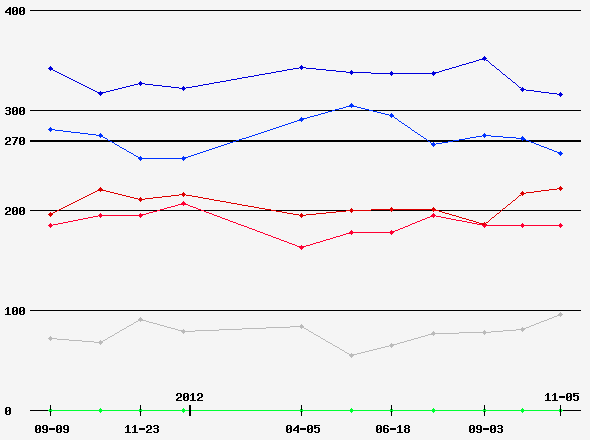
Prediction History
Comments History
- hide
Version: 10 Changes favoring GOP: OK and WY from R > 60 to R > 70; WV from R > 50 to R > 60; Iowa from toss-up to leans GOP. Version: 9 Change favoring the Dems: WV from Dem > 60 to Dem >50. Version: 8 Changes favoring Dems: FL from solid to leans GOP. PA and CO from lean GOP to toss-ups. OR and MN from toss-ups to lean Dem. HI and VT from D>50 to D>60. Version: 7 Changes favoring Obama: ME-2 from GOP to Dem. ID and WY from R>70 to R<60. IN from R>60 to R>50. VA from solid to leans GOP. NV and NH from leans GOP to toss-ups. MA from leans to solid Dem. Version: 6 Changes favoring Dems: NM from GOP to Dem; WA, ME-AL, and ME-1 from toss-up to leans Dem; CT from leans to solid Dem; IA from leans GOP to toss-up; TX and MT from R>60 to R>50. Version: 5 Things are getting much worse for the president. Between his war with the Supreme Court, his almost certain defeat over Obamacare in June, gas prices, inflation, unemployment, and already having to play all the trump cards this early, i.e. "Republicans hate women," and "White people murdered my son, Trayvon," he has no arguments left. His dirty tricks have backfired so far (except for the Fluke one, which has worked for the time being). But it's a long time to the election. Obama can say Romney's boring. He can play class warfare. But he can't make Romney scary. Or a wingnut after the wingnuts just spent 6 months beating the tar out of him for not being wingnutty enough. This election will progress, and I think that by the time the debates are over, this will be what the map will look like. And barring an October surprise, this will be what it looks like on November 6. Version: 4 Moved Iowa to the Dems and Maine (2nd CD) to the GOP. Also made changes in confidence and margins. This map is Romney v Obama which is what appears to be the likely matchup. VA, NC, NE (2), and IN are gone for the President. MT, MO, and AZ will not be targets this time around for him either, even though he's said they will be. He's also made whispers about going after GA, TX, and the Dakotas...but I don't think anyone believes he's serious in this climate. That leaves all GOP states from 2008 safe plus the 3 states and 1 district mentioned above. Also, FL and NH are leaning strongly to Romney. That leaves (in order of likelihood of a GOP win) OH, CO, NV, PA, MI, IA, and ME as the tossups with 8 other states possible if Obama crashes. In order of likelihood of a GOP win in these leaning Obama states, they are MN, WI, NM, OR, WA, NJ, CT, and MA. Version: 3 A few changes. PA back to GOP and WI to Dems. Also a few margins and confidence switcheroos. This is Romney v. Obama. Version: 2 Most states need no explanation. I have NC and VA as solid GOP because I believe any talk of Obama winning them again is just for show. There's no real possibility there. NE (district 2) and IN have already been basically written off by the Dems. I believe that FL, OH, and CO all lean to the GOP nominee (at this time, presumably Romney). WA, OR, CT, NJ, MN, and most of ME lean to Obama at this point in time, but they are much more competitive than he would like. That leaves the toss-up states. On my map, all the tossups were won by Obama in 2008 and any one of them would put the GOP nominee over the top if he/she were to lose CO (the most tentative "leaning" GOP state) and all my other solid and leaning predictions were still correct. If the GOP nominee wins CO and the other leaning/solid GOP states, he/she will need to win NONE of the tossups to secure the presidency. The GOP nominee probably has to win FL and OH to win. In order of current liklihood of a GOP win, the tossups are: NH, NV, IA, MI, WI, PA, and NM. Of these 7 states, I currently have the GOP winning the first 5. Also note that the 2nd congressional district of ME is currently a tossup, but has been tipped to Obama here (that 1 EV alone would not lead to a GOP winning the presidency if he/she fails to carry CO, however winning all of ME would). The major differences to this map from the last one are basically giving NM and PA to Obama. But that may change in the next few months. Version: 1 The President is deflating fast. If the GOP Nominee wins the relatively easy Nebraska CD2, VA, NC, IN, and FL, he/she then only needs a few more electoral votes to win. This can be accomplished most easily by winning OH, which appears likely, and any 1 of the following 10 in order of likelihood: CO, NV, IA, NH, MI, WI, NM, PA, MN, ME. Currently, I feel that the Rep would win the first 8 of 10, but any 1 would suffice. Meaning if the race tightens, and Obama makes something of a comeback, the election could easily come down to OH and CO. If Obama continues to bottom out, the GOP will begin to watch OR, NJ, and WA, in that order. But that would require current trends to hold steady and not level out or rebound.
Version History Member Comments User's Predictions
User Info
Links
|
|||||||||||||||||||||||||||||||||||||||||||||||||||||||||||||||||||||||||||||||||||||||||||||||||||||||||||||||||||||||||||||||||||||||||||||||||||||||||||||||||||||||||||||||||||||||||||||||||||||||||||||||||||||||||||||||||||||||||||||||||||||||||||||||||||||||||||||||||||||||||||||||||||||||||||||||||||||||||||||||||||||||||||||||||||||||||||||||||||||||||||||||||||||||||||||||||||||||||||||||||||||||||||||||||||||||||||||||||||||||||||||||||||||||||||||||||||||||||||||||||||||||||||||||||||||||||||||||||||||||
 2024 President
 2023 Governor
 2022 Senate
 2022 Governor
 2021 Governor
 2020 President
 2020 Senate
 2020 Governor
 2019 Governor
 2018 Senate
 2018 Governor
 2017 Governor
 2016 President
 2016 Senate
 2016 Governor
 2015 Governor
 2014 Senate
 2014 Governor
 2013 Governor
 2012 President
 2012 Senate
 2012 Governor
 2012 Rep Primary
 2011 Governor
 2010 Senate
 2010 Governor
 2009 Governor
 2008 President
 2008 Senate
 2008 Governor
 2008 Dem Primary
 2008 Rep Primary
 2007 Governor
 2006 U.S. Senate
 2006 Governor
 2004 President


Back to 2012 Presidential Prediction Home - Predictions Home