


|
Date of Prediction: 2012-10-09 Version:3
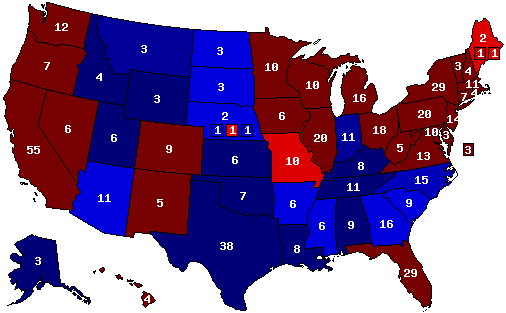
Prediction Map
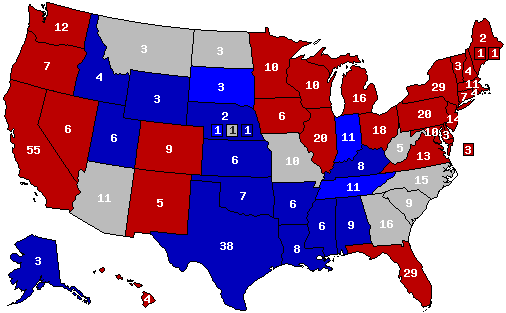
Confidence Map
Prediction States Won
Confidence States Won
State Pick-ups
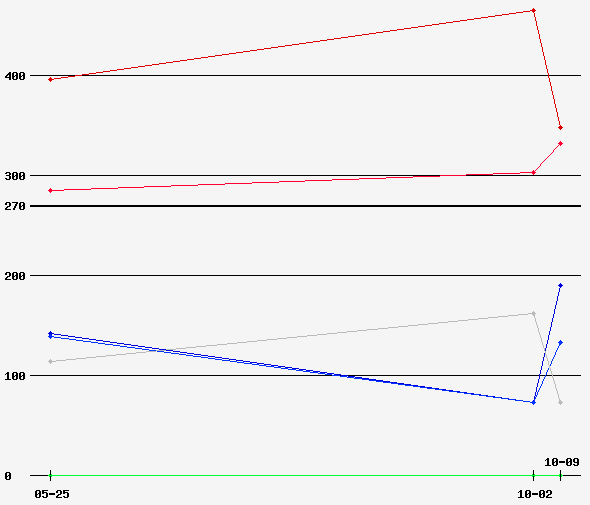
Prediction Score (max Score = 112)
Analysis
The debate not only gave Romney momentum, but has decreased other electoral college maps for Romney. A Pew Poll has Romney leading Obama, 49-45%, but stlll losing the electoral college by a wide margin. But, even more ominous for Romney is the Gallup poll. It is usually accurate in October for predicting the presidential race. Obama leads Romney, 50%-46% among registered voters, but tied among likely voters. It has been wrong 3 times. The results have been wrong only 3 times: 04, 1976, and 1948. Also, each time an incumbent president goes to the people, the crowds are always large, and the incumbent wins. In 1980, and 1992, neither Carter or Bush went to the people. They both had controlled events. Obama's biggest asset is himself. People love seeing their president in person, and, are swayed in voting for him.
Prediction History
Comments History
- show
Version History User's Predictions
Links
|
||||||||||||||||||||||||||||||||||||||||||||||||||||||||||||||||||||||||||||||||||||||||||||||||||||||||||||||||||||||||||||||||||||||||||||||||||||||||||||||||||||||||||||||||||||||||||||||||||||||||||||||||||||||||||||||||||||||||||||||||||||||
 2016 President
 2016 Senate
 2016 Governor
 2012 President
 2012 Senate
 2012 Governor
 2010 Senate
 2010 Governor
 2008 President
 2004 President


Back to 2012 Presidential Prediction Home - Predictions Home