


Note: The Google advertisement links below may advocate political positions that this site does not endorse.
|
Date of Prediction: 2015-08-28 Version:5
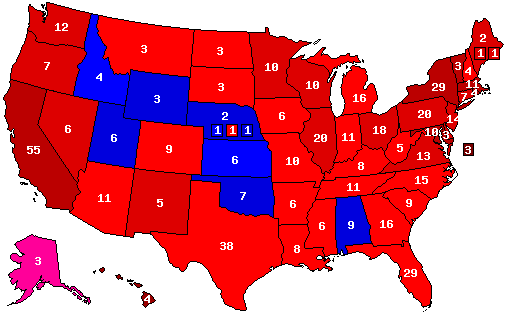
Prediction Map
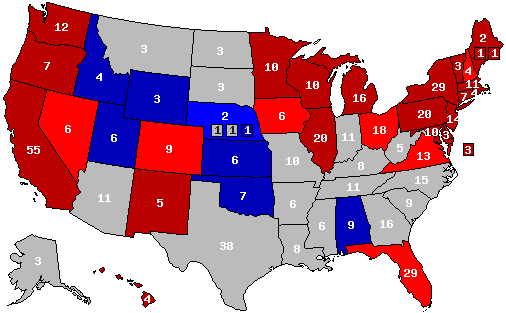
Confidence Map
Prediction States Won
Confidence States Won
State Pick-ups
Analysis
This is a map for a 3-way election. This assumes either Trump makes good on his threat to run as an independent if not nominated by the Republicans. Or, as an alternative you could assume a more significant than usual minor candidacy by a 3rd party (such as the Libertarians) due to a lackluster Republican nominee. A split conservative vote would hand Hillary the vast majority of states and Electoral Votes with them by narrow pluralities. Please feel free to add speculation in appropriate comments.
Prediction History

Comments History
- show
Version History Member Comments
User's Predictions
Links
|
||||||||||||||||||||||||||||||||||||||||||||||||||||||||||||||||||||||||||||||||||||||||||||||||||||||||||||||||||||||||||||||||||||||||||||||||||||||||||||||||||||||||||||||||||||||||||||||||||||||||||||||||||||||||||||||||||||||||||||||||||

 2022 Senate
 2020 President
 2020 Senate
 2016 President
 2016 Senate
 2014 Senate
 2014 Governor
 2013 Governor
 2012 President
 2012 Senate
 2012 Rep Primary


Back to 2016 Presidential Prediction Home - Predictions Home
© Dave Leip's Atlas of U.S. Elections, LLC 2019 All Rights Reserved