


Note: The Google advertisement links below may advocate political positions that this site does not endorse.
|
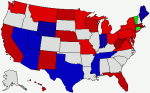
Date of Prediction: 2006-11-05 Version:17
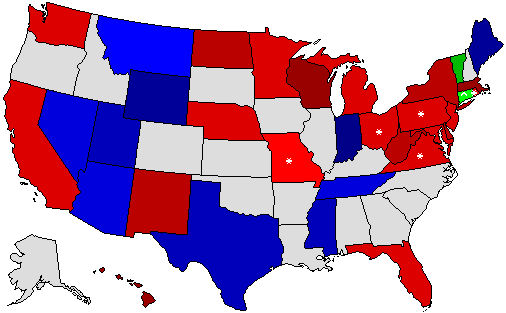
Prediction Map
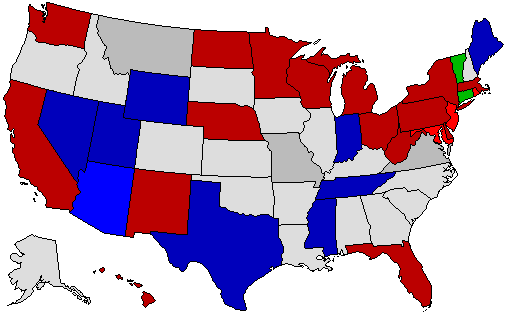
* = Pickup via defeat of incumbent; ^ = Pickup of an open seat Confidence Map
Prediction States Won
Confidence States Won
State Pick-ups
Predicted Senate Control (110th Congress):
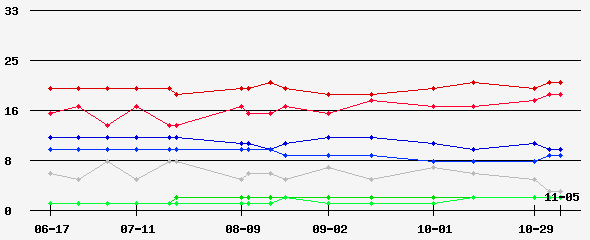
Prediction Score (max Score = 66)
Comments
This is likely my final prediction.
Prediction History
Comments History
- hide
Version: 8 Never mind. Sanders is only running in the Democrat primary to prevent any Democrats from getting on the ballot. Version: 4 A few minor changes with the percentages on the prediction map. Version: 3 The races in Maryland and Minnesota are closer than I thought.
Version History Member Comments By: Angry_Weasel (D-VA) - 2006-11-05 @ 16:02:11
User's Predictions
Links
|
|||||||||||||||||||||||||||||||||||||||||||||||||||||||||||||||||||||||||||||||||||||||||||||||||||||||||||||||||||||||||||||||||||||||||||||||||||||||||||||||||||||||||||||||||||||||||||||||||||||||||||||||||||||||||||||||||||||||||||||||||||||||||||||||||||||||||||||||||||||||||||||||||||||||||||||||||||||||||||||||||||||||||||||||||||||||||||||||||||||||||||||||||||||||||||||||||||||||||||
 2022 Senate
 2022 Governor
 2020 President
 2020 Senate
 2018 Senate
 2018 Governor
 2016 President
 2012 President
 2012 Senate
 2011 Governor
 2010 Senate
 2010 Governor
 2009 Governor
 2008 President
 2008 Senate
 2008 Governor
 2008 Dem Primary
 2008 Rep Primary
 2007 Governor
 2006 U.S. Senate
 2006 Governor
Back to 2006 Senatorial Prediction Home - Predictions Home
© Dave Leip's Atlas of U.S. Elections, LLC 2019 All Rights Reserved