


Note: The Google advertisement links below may advocate political positions that this site does not endorse.
|
Date of Prediction: 2006-11-07 Version:4
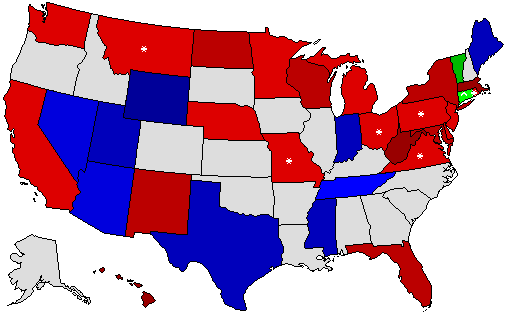
Prediction Map
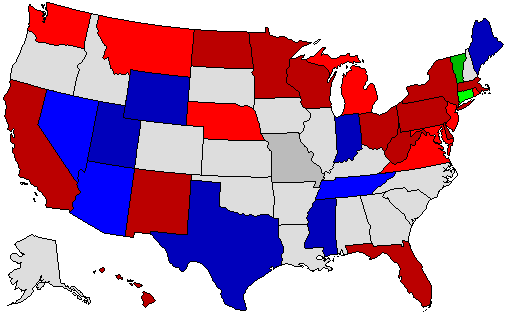
* = Pickup via defeat of incumbent; ^ = Pickup of an open seat Confidence Map
Prediction States Won
Confidence States Won
State Pick-ups
Predicted Senate Control (110th Congress):
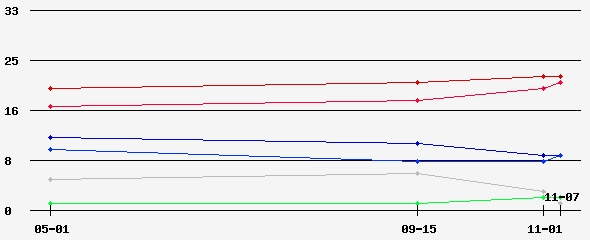
Prediction Score (max Score = 66)
Comments
11/7/06 FINAL: Dem 51 Rep 49. The Democrats will hold MD and NJ, and squeak by in RI, MT and yes, Virginia (but not TN). Jim Webb will win VA (or, to put it more precisely, George Allen will lose). The cliffhanger tonight willl come in--Missouri. Neither side has generated momentum, but I believe the stem cell debate will flip this to McCaskill. If there is one Republican sleeper, it may be RI: will some Democrats, once inside the voting booth feel a need to "excuse" Chafee? I would like to think not.
Prediction History
Comments History
- show
Version History Member Comments User's Predictions
Links
|
||||||||||||||||||||||||||||||||||||||||||||||||||||||||||||||||||||||||||||||||||||||||||||||||||||||||||||||||||||||||||||||||||||||||||||||||||||||||||||||||||||||||||||||||||||||||||||||||||||||||||||||||||||||||||||||||||||||||||||||||||||||||||||||||||||||||||||||||||||||||||||||||||||||||||||||||||||||||||||||||||||||||||||||||||||||||||||||||||||||||||||||||||||||||||||||||||||||||||||||||||||||||||||||||||||||||||
 2022 Senate
 2022 Governor
 2020 President
 2020 Senate
 2020 Governor
 2018 Senate
 2018 Governor
 2016 President
 2016 Senate
 2016 Governor
 2014 Senate
 2014 Governor
 2012 President
 2012 Senate
 2012 Governor
 2010 Senate
 2010 Governor
 2008 President
 2008 Senate
 2008 Dem Primary
 2008 Rep Primary
 2006 U.S. Senate
 2006 Governor
 2004 President
Back to 2006 Senatorial Prediction Home - Predictions Home
© Dave Leip's Atlas of U.S. Elections, LLC 2019 All Rights Reserved