PredictionsEndorse2010 Senatorial Predictions - Zacoftheaxes (D-NY) ResultsPolls
Note: The Google advertisement links below may advocate political positions that this site does not endorse.
Date of Prediction: 2010-10-10 Version:1

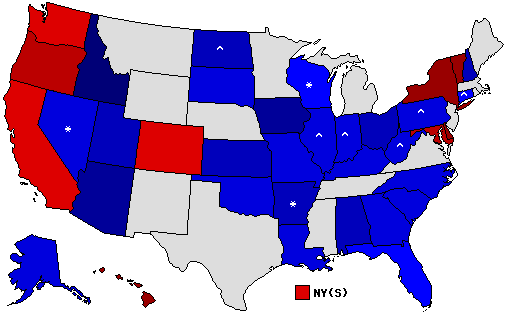
Prediction Map
Zacoftheaxes MapPrediction Key

* = Pickup via defeat of incumbent; ^ = Pickup of an open seat

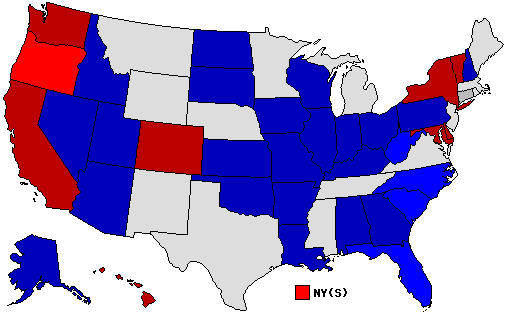
Confidence Map
Zacoftheaxes MapConfidence Key

Prediction States Won
19 |
37 |
37 |
Dem10
 
pie
Rep27
 
Ind0
 
Non0
 

Confidence States Won
19 |
37 |
37 |
Dem10
 
pie
Rep26
 
Ind0
 
Tos1
 
Non0
 

State Pick-ups

Gain Loss Hold Net Gain
Inc. Open Total Inc. Open Total Inc. Open Total
Dem000-3-6-99110-9
Rep+3+6+900010818+9
Ind0000000000


Predicted Senate Control (112th Congress):
Party Seats Up Seats Not Up Total Seats
Democratic103848
Republican272350
Independent022
pie

Prediction Score (max Score = 74)

ScoreState WinsState Percentages
483315
piepiepie

Analysis
No Analysis Entered

Member Comments
 By: JohnLV (O-NV) 2010-10-10 @ 18:07:03 prediction Map
How is Colorado solid Dem? The last two weeks polls average out to Rep +5.

 By: KS21 (I-KS) 2010-10-11 @ 08:45:29 prediction Map
Let's not be like Svennson, JohnLV.

He's entitled to his opinion.

 By: CR (--MO) 2010-10-11 @ 10:08:57 prediction Map
But he is entitled to question other posters about their predictions same as you and I.

 By: KS21 (I-KS) 2010-10-11 @ 10:29:44 prediction Map
JohnLV has been going around with rather vicous, unproductive attacks of late. Look at my map, V. 181.

 By: CR (--MO) 2010-10-11 @ 10:48:27 prediction Map
But on this map version he is simply asking for an explanation on Colorado. I think its a valid question too as the OP has it as a solid Democratic retention when in the polling it is clearly a tossup leaning in the GOP's favor.

 By: dnul222 (D-MN) 2010-10-11 @ 11:04:17 prediction Map
I agree with CR, why is CO Dem while CT is GOP...while polls are in the other direction for both...


User's Predictions

Prediction Score States Percent Total Accuracy Ver #D Rank#Pred
P 2020 President 50/56 36/56 86/112 76.8% pie 2 28 529T684
P 2016 President 48/56 32/56 80/112 71.4% pie 1 399 246T678
P 2014 Governor 32/36 17/36 49/72 68.1% pie 1 358 56T300
P 2012 President 55/56 43/56 98/112 87.5% pie 3 0 182T760
P 2012 Rep Primary 39/52 11/52 50/104 48.1% pie 9 - 71T231
P 2010 Senate 33/37 15/37 48/74 64.9% pie 1 23 265T456
Aggregate Predictions 257/293 154/293 411/586 70.1% pie


Back to 2010 Senatorial Prediction Home - Predictions Home


Terms of Use - DCMA Policy - Privacy Policy and Cookies

© Dave Leip's Atlas of U.S. Elections, LLC 2019 All Rights Reserved