


|
Date of Prediction: 2010-11-02 Version:1
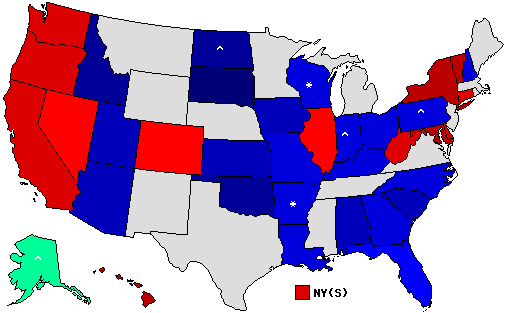
Prediction Map
* = Pickup via defeat of incumbent; ^ = Pickup of an open seat Confidence Map
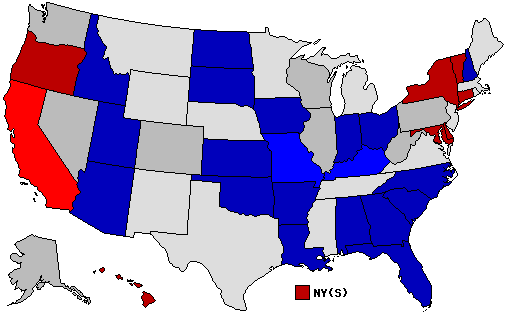
Prediction States Won
Confidence States Won
State Pick-ups
Predicted Senate Control (112th Congress):
Prediction Score (max Score = 74)
Analysis
I have almost no confidence in predicting Nevada, Colorado, Illinois, and Alaska. The first three are essentially coin tosses and Alaska has a very interesting dynamic going on. I think that race could go any way, with a real possibility of it being the only Democratic gain in the Senate this year. Nevada looks like the most worrisome of the group. Any surprises outside of the tossups appear to be very unlikely. I think Wisconsin is pretty close to lean Republican as Feingold appears to be doomed (his winning reelection would pretty much be an upset at this point). This prediction leaves the Senate with a 54-46 balance, probably on the realistic upper end for Democrats. I would expect any result between 51-54 Democratic Senators. Any other outcome probably means one party is doing a good job exceeding expectations. Member Comments User's Predictions
Links
|
|||||||||||||||||||||||||||||||||||||||||||||||||||||||||||||||||||||||||||||||||||||||||||||||||||||||||||||||||||||||||||||||||||||||||||||||||||||||||||||||||||||||||||||||||||||||||||||||||||||||||||||||||||||||||||||||||||||||||||||||||||||||||||||||||||||||||||||||||||||||||||||||||||||||||||||||||||||||||||||||||||||||||||||||||||||||||||||||||||||||||||||||||||||||||||||||||||||||||||||||
 2022 Senate
 2022 Governor
 2020 President
 2020 Senate
 2020 Governor
 2016 President
 2016 Senate
 2016 Governor
 2014 Governor
 2013 Governor
 2012 President
 2012 Senate
 2012 Governor
 2010 Senate
 2010 Governor
 2008 President
 2008 Senate
 2008 Governor
 2007 Governor
 2006 U.S. Senate
 2006 Governor


Back to 2010 Senatorial Prediction Home - Predictions Home