| Map | Pie | Office | Total | D | R | I | Margin | %Margin | Dem | Rep | Ind | Oth. | Dem | Rep | Ind | Other | | | | | | | | | | | | | | | | | | |
|---|
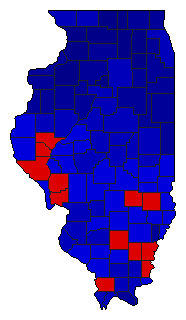
 |  | President |
2,470,067 |
2 |
1 |
3 |
876,346 |
35.48% |
23.36% |
58.84% |
17.49% |
0.31% |
576,975 |
1,453,321 |
432,027 |
7,744 |
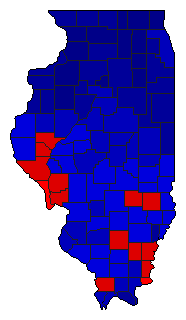
 |  | Senator |
2,280,841 |
2 |
1 |
3 |
642,478 |
28.17% |
35.37% |
63.54% |
0.82% |
0.27% |
806,702 |
1,449,180 |
18,708 |
6,251 |
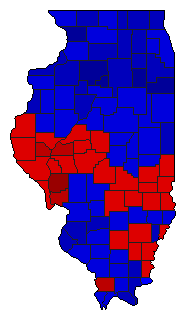 | | Governor |
2,409,131 |
2 |
1 |
0 |
345,038 |
14.32% |
42.40% |
56.72% |
0.00% |
0.88% |
1,021,408 |
1,366,446 |
0 |
21,277 |
 |  | Lt. Governor |
2,252,246 |
2 |
1 |
3 |
775,127 |
34.42% |
32.30% |
66.71% |
0.72% |
0.27% |
727,390 |
1,502,517 |
16,235 |
6,104 |
 | | Secretary of State |
2,256,347 |
2 |
1 |
3 |
923,629 |
40.93% |
29.03% |
69.97% |
0.73% |
0.26% |
655,100 |
1,578,729 |
16,584 |
5,934 |
 |  | State Treasurer |
2,213,647 |
2 |
1 |
3 |
805,267 |
36.38% |
31.34% |
67.71% |
0.79% |
0.17% |
693,658 |
1,498,925 |
17,397 |
3,667 |
 | | Attorney General |
2,252,693 |
2 |
1 |
0 |
719,469 |
31.94% |
33.53% |
65.46% |
0.00% |
1.01% |
755,223 |
1,474,692 |
0 |
22,778 |
 |  | State Auditor |
2,220,944 |
2 |
1 |
3 |
823,255 |
37.07% |
31.00% |
68.07% |
0.76% |
0.17% |
688,603 |
1,511,858 |
16,816 |
3,667 |
|
