| Map | Pie | Office | Total | D | R | I | Margin | %Margin | Dem | Rep | Ind | Oth. | Dem | Rep | Ind | Other | | | | | | | | | | | | | | | | | | |
|---|
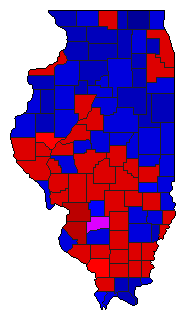
 |  | President |
3,984,046 |
1 |
2 |
0 |
33,612 |
0.84% |
50.07% |
49.22% |
0.00% |
0.71% |
1,994,715 |
1,961,103 |
0 |
28,228 |
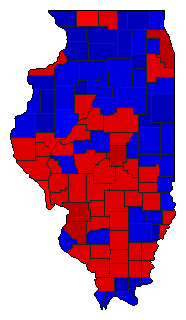
 |  | Senator |
3,900,285 |
1 |
2 |
0 |
407,728 |
10.45% |
55.07% |
44.61% |
0.00% |
0.32% |
2,147,754 |
1,740,026 |
0 |
12,505 |
 | | Governor |
3,940,257 |
1 |
2 |
3 |
572,067 |
14.52% |
57.10% |
42.59% |
0.24% |
0.07% |
2,250,074 |
1,678,007 |
9,491 |
2,685 |
 |  | Secretary of State |
3,892,453 |
1 |
2 |
0 |
361,749 |
9.29% |
54.49% |
45.19% |
0.00% |
0.32% |
2,120,832 |
1,759,083 |
0 |
12,538 |
|
