| Map | Pie | Office | Total | D | R | I | Margin | %Margin | Dem | Rep | Ind | Oth. | Dem | Rep | Ind | Other | | | | | | | | | | | | | | | | | | |
|---|
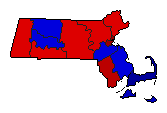 | | Governor |
1,910,161 |
1 |
2 |
3 |
250,501 |
13.11% |
56.26% |
43.14% |
0.41% |
0.19% |
1,074,570 |
824,069 |
7,806 |
3,716 |
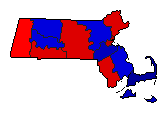
 | | Lt. Governor |
1,865,565 |
1 |
2 |
3 |
111,472 |
5.98% |
52.64% |
46.66% |
0.70% |
0.00% |
982,014 |
870,542 |
13,009 |
0 |
 | | Secretary of State |
1,829,935 |
1 |
2 |
4 |
203,470 |
11.12% |
54.90% |
43.78% |
0.59% |
0.73% |
1,004,632 |
801,162 |
10,743 |
13,398 |
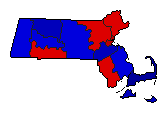
 |  | State Treasurer |
1,827,245 |
1 |
2 |
3 |
398,763 |
21.82% |
60.27% |
38.45% |
0.65% |
0.62% |
1,101,367 |
702,604 |
11,968 |
11,306 |
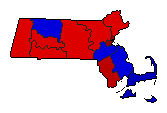
 |  | Attorney General |
1,845,266 |
1 |
2 |
3 |
88,391 |
4.79% |
51.88% |
47.09% |
0.72% |
0.32% |
957,262 |
868,871 |
13,237 |
5,896 |
 |  | State Auditor |
1,827,746 |
1 |
2 |
4 |
358,292 |
19.60% |
59.22% |
39.61% |
0.43% |
0.74% |
1,082,350 |
724,058 |
7,844 |
13,494 |
|
