| Map | Pie | Office | Total | D | R | I | Margin | %Margin | Dem | Rep | Ind | Oth. | Dem | Rep | Ind | Other | | | | | | | | | | | | | | | | | | |
|---|
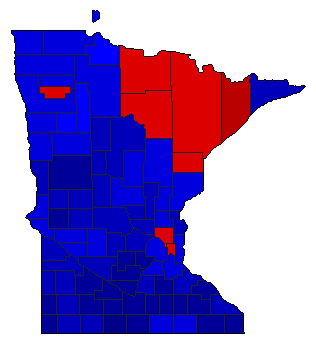
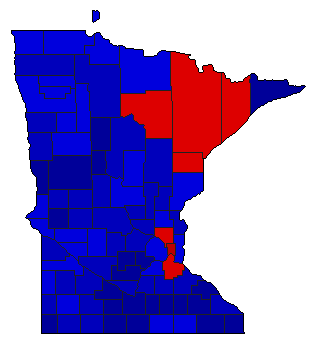
 |  | President |
1,379,483 |
2 |
1 |
- |
154,753 |
11.22% |
44.11% |
55.33% |
0.00% |
0.57% |
608,458 |
763,211 |
0 |
7,814 |
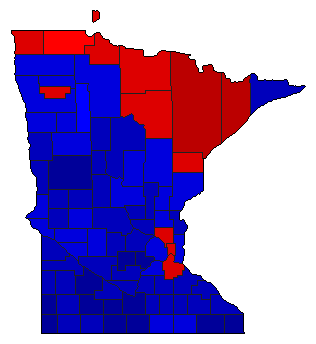
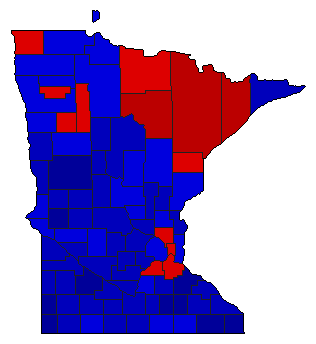
 | | Senator |
1,387,419 |
2 |
1 |
0 |
195,638 |
14.10% |
42.53% |
56.63% |
0.00% |
0.85% |
590,011 |
785,649 |
0 |
11,759 |
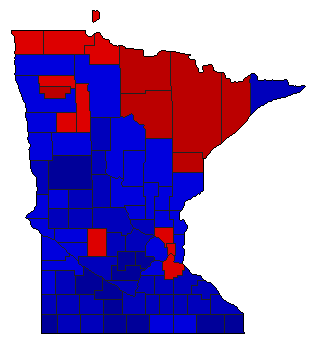
 | | Governor |
1,418,869 |
2 |
1 |
0 |
160,645 |
11.32% |
44.01% |
55.33% |
0.00% |
0.65% |
624,480 |
785,125 |
0 |
9,264 |
 | | Lt. Governor |
1,346,157 |
2 |
1 |
0 |
115,785 |
8.60% |
45.70% |
54.30% |
0.00% |
0.00% |
615,186 |
730,971 |
0 |
0 |
 |  | Secretary of State |
1,379,593 |
2 |
1 |
0 |
168,233 |
12.19% |
43.90% |
56.10% |
0.00% |
0.00% |
605,680 |
773,913 |
0 |
0 |
 |  | State Treasurer |
1,345,056 |
2 |
1 |
0 |
161,274 |
11.99% |
44.00% |
56.00% |
0.00% |
0.00% |
591,891 |
753,165 |
0 |
0 |
 |  | Attorney General |
1,354,261 |
2 |
1 |
0 |
232,741 |
17.19% |
41.41% |
58.59% |
0.00% |
0.00% |
560,760 |
793,501 |
0 |
0 |
|
