| Map | Pie | Office | Total | D | R | I | Margin | %Margin | Dem | Rep | Ind | Oth. | Dem | Rep | Ind | Other | | | | | | | | | | | | | | | | | | |
|---|
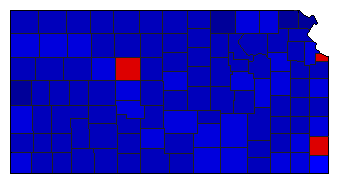
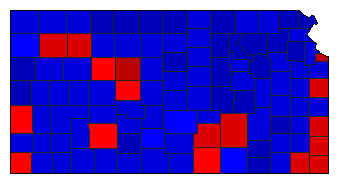
 |  | President |
866,243 |
2 |
1 |
0 |
270,561 |
31.23% |
34.21% |
65.44% |
0.00% |
0.35% |
296,317 |
566,878 |
0 |
3,048 |
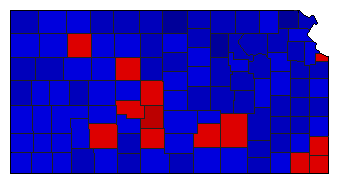
 |  | Senator |
825,280 |
2 |
1 |
0 |
143,883 |
17.43% |
40.46% |
57.90% |
0.00% |
1.64% |
333,939 |
477,822 |
0 |
13,519 |
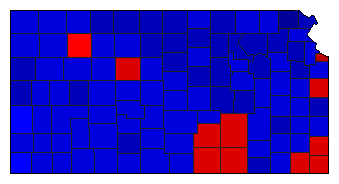
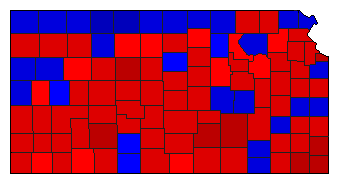 |  | Governor |
864,935 |
1 |
2 |
0 |
115,361 |
13.34% |
55.46% |
42.12% |
0.00% |
2.42% |
479,701 |
364,340 |
0 |
20,894 |
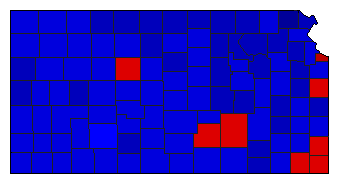
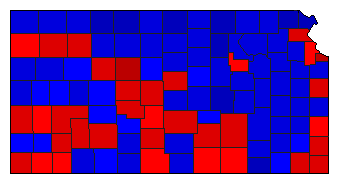 |  | Lt. Governor |
804,402 |
1 |
2 |
0 |
11,413 |
1.42% |
49.28% |
47.86% |
0.00% |
2.85% |
396,428 |
385,015 |
0 |
22,959 |
 |  | Secretary of State |
798,304 |
2 |
1 |
0 |
79,489 |
9.96% |
43.92% |
53.88% |
0.00% |
2.19% |
350,649 |
430,138 |
0 |
17,517 |
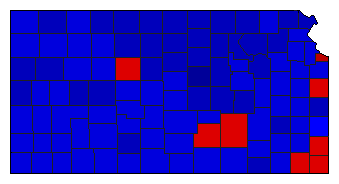
 |  | State Treasurer |
793,008 |
2 |
1 |
0 |
39,963 |
5.04% |
46.48% |
51.52% |
0.00% |
2.00% |
368,597 |
408,560 |
0 |
15,851 |
 |  | Attorney General |
791,035 |
2 |
1 |
0 |
78,051 |
9.87% |
45.07% |
54.93% |
0.00% |
0.00% |
356,492 |
434,543 |
0 |
0 |
 |  | State Auditor |
796,716 |
2 |
1 |
0 |
58,691 |
7.37% |
45.29% |
52.66% |
0.00% |
2.05% |
360,831 |
419,522 |
0 |
16,363 |
 |  | Insurance Commissioner |
783,576 |
2 |
1 |
0 |
71,622 |
9.14% |
44.26% |
53.40% |
0.00% |
2.34% |
346,798 |
418,420 |
0 |
18,358 |
|
