| Map | Pie | Office | Total | D | R | I | Margin | %Margin | Dem | Rep | Ind | Oth. | Dem | Rep | Ind | Other | | | | | | | | | | | | | | | | | | |
|---|
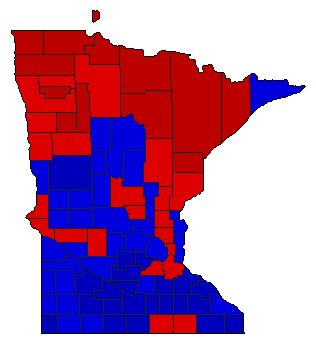
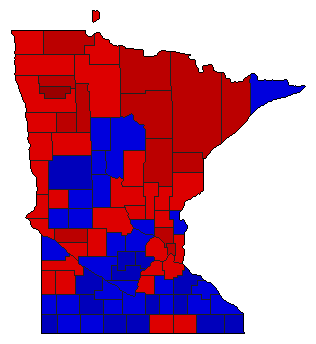 | | Senator |
1,144,476 |
1 |
2 |
0 |
73,218 |
6.40% |
53.20% |
46.80% |
0.00% |
0.00% |
608,847 |
535,629 |
0 |
0 |
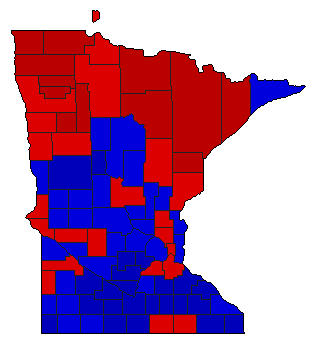
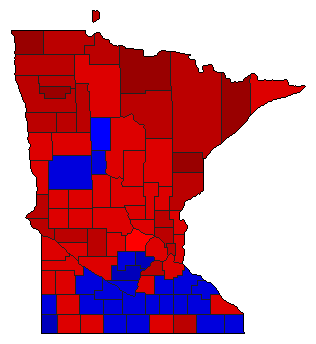 | | Governor |
1,159,915 |
1 |
2 |
3 |
167,595 |
14.45% |
56.76% |
42.31% |
0.94% |
0.00% |
658,326 |
490,731 |
10,858 |
0 |
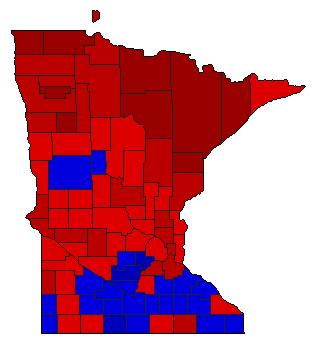 |  | Lt. Governor |
1,117,012 |
1 |
2 |
0 |
180,870 |
16.19% |
58.10% |
41.90% |
0.00% |
0.00% |
648,941 |
468,071 |
0 |
0 |
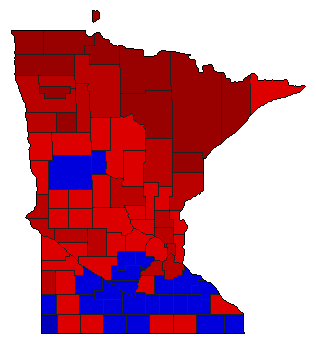 |  | Secretary of State |
1,130,662 |
1 |
2 |
0 |
177,612 |
15.71% |
57.85% |
42.15% |
0.00% |
0.00% |
654,137 |
476,525 |
0 |
0 |
 |  | State Treasurer |
1,128,336 |
2 |
1 |
0 |
6,734 |
0.60% |
49.70% |
50.30% |
0.00% |
0.00% |
560,801 |
567,535 |
0 |
0 |
 |  | Attorney General |
1,126,329 |
1 |
2 |
0 |
129,373 |
11.49% |
55.74% |
44.26% |
0.00% |
0.00% |
627,851 |
498,478 |
0 |
0 |
 |  | State Auditor |
1,122,436 |
2 |
1 |
0 |
26,764 |
2.38% |
48.81% |
51.19% |
0.00% |
0.00% |
547,836 |
574,600 |
0 |
0 |
| | | Map | Pie | Initiative | Total Vote | N | | Y | Margin | %Margin | No | | Yes | Oth. | No | | Yes | |
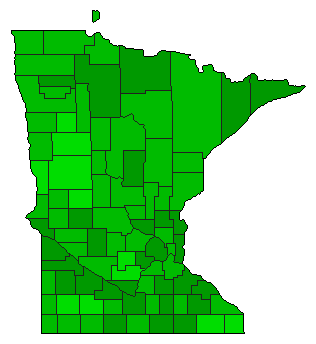 |  | Amendment |
1,022,400 |
2 |
0 |
1 |
402,704 |
39.39% |
30.31% |
0.00% |
69.69% |
0.00% |
309,848 |
0 |
712,552 |
0 |
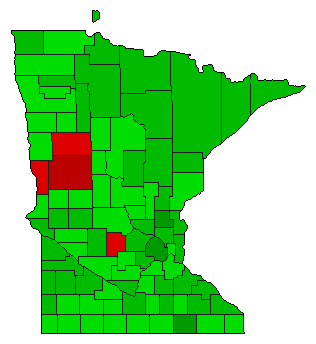 |  | Amendment |
1,024,392 |
2 |
0 |
1 |
259,382 |
25.32% |
37.34% |
0.00% |
62.66% |
0.00% |
382,505 |
0 |
641,887 |
0 |
 |  | Amendment |
1,006,412 |
2 |
0 |
1 |
146,188 |
14.53% |
42.74% |
0.00% |
57.26% |
0.00% |
430,112 |
0 |
576,300 |
0 |
|
