| Map | Pie | Office | Total | D | R | I | Margin | %Margin | Dem | Rep | Ind | Oth. | Dem | Rep | Ind | Other | | | | | | | | | | | | | | | | | | |
|---|
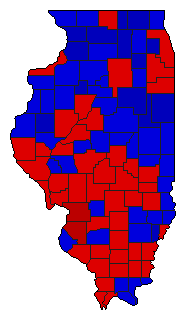
 |  | President |
4,757,409 |
1 |
2 |
0 |
8,858 |
0.19% |
49.98% |
49.80% |
0.00% |
0.22% |
2,377,846 |
2,368,988 |
0 |
10,575 |
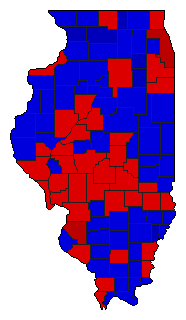
 | | Senator |
4,632,796 |
1 |
2 |
3 |
437,097 |
9.43% |
54.63% |
45.20% |
0.17% |
0.00% |
2,530,943 |
2,093,846 |
8,007 |
0 |
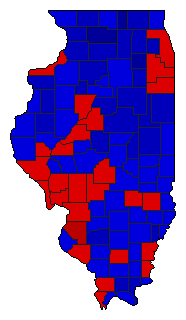
 | | Governor |
4,674,187 |
1 |
2 |
0 |
524,252 |
11.22% |
55.51% |
44.30% |
0.00% |
0.19% |
2,594,731 |
2,070,479 |
0 |
8,977 |
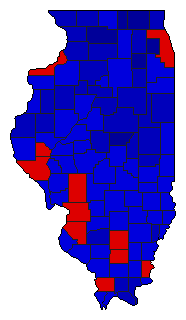
 | | Lt. Governor |
4,569,883 |
1 |
2 |
3 |
236,103 |
5.17% |
52.49% |
47.32% |
0.19% |
0.00% |
2,398,746 |
2,162,643 |
8,494 |
0 |
 | | Secretary of State |
4,633,828 |
2 |
1 |
0 |
384,916 |
8.31% |
45.76% |
54.06% |
0.00% |
0.18% |
2,120,339 |
2,505,255 |
0 |
8,234 |
|
