| Map | Pie | Office | Total | D | R | I | Margin | %Margin | Dem | Rep | Ind | Oth. | Dem | Rep | Ind | Other | | | | | | | | | | | | | | | | | | |
|---|
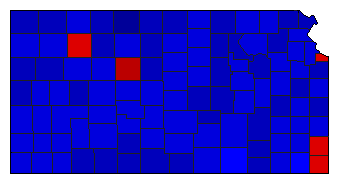
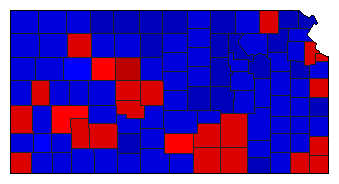
 |  | President |
928,825 |
2 |
1 |
0 |
198,261 |
21.35% |
39.10% |
60.45% |
0.00% |
0.45% |
363,213 |
561,474 |
0 |
4,138 |
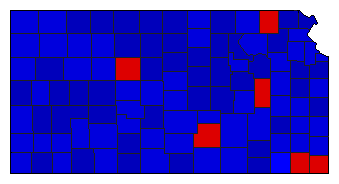
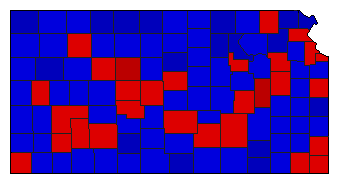
 |  | Senator |
888,592 |
2 |
1 |
0 |
96,604 |
10.87% |
43.77% |
54.64% |
0.00% |
1.60% |
388,895 |
485,499 |
0 |
14,198 |
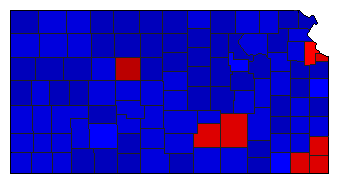
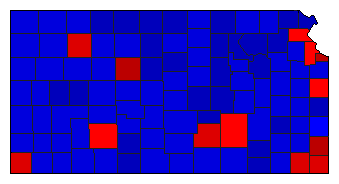
 |  | Governor |
922,522 |
2 |
1 |
0 |
109,273 |
11.85% |
43.60% |
55.45% |
0.00% |
0.95% |
402,261 |
511,534 |
0 |
8,727 |
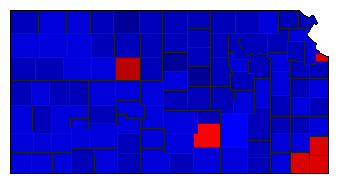
 |  | Lt. Governor |
865,943 |
2 |
1 |
0 |
79,087 |
9.13% |
44.60% |
53.73% |
0.00% |
1.67% |
386,208 |
465,295 |
0 |
14,440 |
 |  | Secretary of State |
860,370 |
2 |
1 |
0 |
117,035 |
13.60% |
42.18% |
55.79% |
0.00% |
2.03% |
362,931 |
479,966 |
0 |
17,473 |
 |  | State Treasurer |
850,559 |
2 |
1 |
0 |
29,627 |
3.48% |
47.40% |
50.89% |
0.00% |
1.71% |
403,185 |
432,812 |
0 |
14,562 |
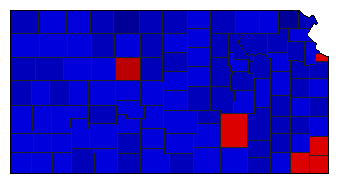
 |  | Attorney General |
860,929 |
2 |
1 |
0 |
10,641 |
1.24% |
49.38% |
50.62% |
0.00% |
0.00% |
425,144 |
435,785 |
0 |
0 |
 |  | State Auditor |
846,492 |
2 |
1 |
0 |
55,348 |
6.54% |
45.55% |
52.09% |
0.00% |
2.36% |
385,567 |
440,915 |
0 |
20,010 |
 |  | Insurance Commissioner |
835,104 |
2 |
1 |
0 |
93,280 |
11.17% |
44.42% |
55.58% |
0.00% |
0.00% |
370,912 |
464,192 |
0 |
0 |
|
