| Map | Pie | Office | Total | D | R | I | Margin | %Margin | Dem | Rep | Ind | Oth. | Dem | Rep | Ind | Other | | | | | | | | | | | | | | | | | | |
|---|
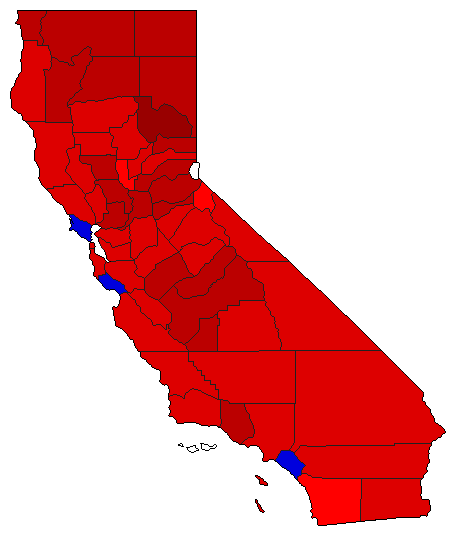
 | | Senator |
5,647,972 |
2 |
1 |
3 |
727,664 |
12.88% |
43.43% |
56.31% |
0.26% |
0.00% |
2,452,839 |
3,180,503 |
14,630 |
0 |
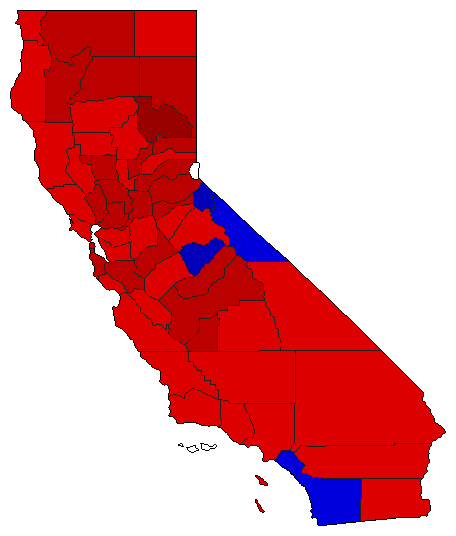
 | | Governor |
5,853,270 |
1 |
2 |
3 |
296,758 |
5.07% |
51.89% |
46.82% |
1.30% |
0.00% |
3,037,109 |
2,740,351 |
75,810 |
0 |
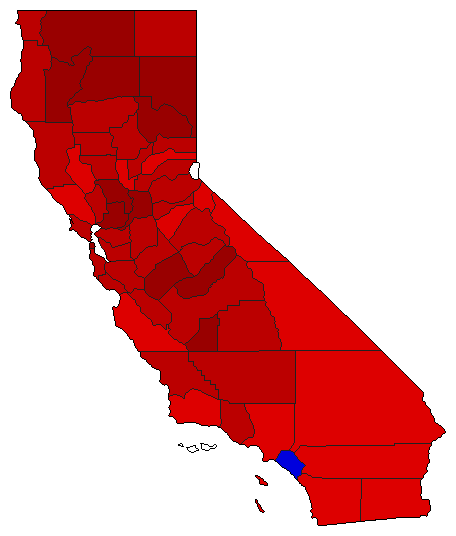
 |  | Lt. Governor |
5,752,160 |
1 |
2 |
0 |
163,683 |
2.85% |
51.42% |
48.57% |
0.00% |
0.01% |
2,957,640 |
2,793,957 |
0 |
563 |
 |  | Secretary of State |
5,548,071 |
2 |
1 |
0 |
872,980 |
15.73% |
42.13% |
57.87% |
0.00% |
0.00% |
2,337,458 |
3,210,438 |
0 |
175 |
 |  | State Treasurer |
5,553,555 |
1 |
2 |
0 |
675,601 |
12.17% |
55.09% |
42.92% |
0.00% |
1.99% |
3,059,270 |
2,383,669 |
0 |
110,616 |
 |  | Attorney General |
5,671,878 |
1 |
2 |
0 |
687,895 |
12.13% |
56.06% |
43.93% |
0.00% |
0.00% |
3,179,795 |
2,491,900 |
0 |
183 |
 |  | Controller |
5,607,197 |
1 |
2 |
0 |
1,258,314 |
22.44% |
60.15% |
37.71% |
0.00% |
2.14% |
3,372,691 |
2,114,377 |
0 |
120,129 |
|
