| Map | Pie | Office | Total | D | R | I | Margin | %Margin | Dem | Rep | Ind | Oth. | Dem | Rep | Ind | Other | | | | | | | | | | | | | | | | | | |
|---|
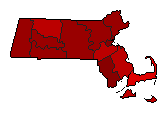
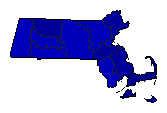
 |  | President |
2,344,798 |
1 |
2 |
0 |
1,236,695 |
52.74% |
76.19% |
23.44% |
0.00% |
0.37% |
1,786,422 |
549,727 |
0 |
8,649 |
 | | Senator |
2,312,028 |
1 |
2 |
3 |
1,129,244 |
48.84% |
74.26% |
25.42% |
0.21% |
0.12% |
1,716,907 |
587,663 |
4,745 |
2,713 |
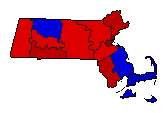
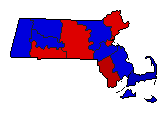 | | Governor |
2,340,130 |
2 |
1 |
3 |
23,046 |
0.98% |
49.29% |
50.27% |
0.27% |
0.17% |
1,153,416 |
1,176,462 |
6,273 |
3,979 |
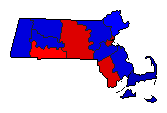 | | Lt. Governor |
2,234,340 |
2 |
1 |
3 |
24,605 |
1.10% |
49.11% |
50.22% |
0.43% |
0.24% |
1,097,380 |
1,121,985 |
9,551 |
5,424 |
 | | Secretary of State |
2,209,208 |
1 |
2 |
3 |
950,977 |
43.05% |
71.20% |
28.15% |
0.38% |
0.27% |
1,572,871 |
621,894 |
8,369 |
6,074 |
 |  | State Treasurer |
2,167,826 |
1 |
2 |
4 |
628,328 |
28.98% |
64.16% |
35.18% |
0.29% |
0.37% |
1,390,921 |
762,593 |
6,295 |
8,017 |
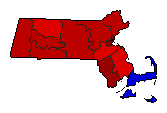
 | | Attorney General |
2,298,036 |
2 |
1 |
3 |
797,510 |
34.70% |
32.48% |
67.18% |
0.21% |
0.13% |
746,390 |
1,543,900 |
4,716 |
3,030 |
 |  | State Auditor |
2,137,030 |
1 |
2 |
3 |
378,861 |
17.73% |
58.38% |
40.66% |
0.53% |
0.43% |
1,247,674 |
868,813 |
11,368 |
9,175 |
| | | Map | Pie | Initiative | Total Vote | N | | Y | Margin | %Margin | No | | Yes | Oth. | No | | Yes | |
 |  | Initiative |
1,722,843 |
2 |
0 |
1 |
544,405 |
31.60% |
34.20% |
0.00% |
65.80% |
0.00% |
589,219 |
0 |
1,133,624 |
0 |
|
