| Map | Pie | Office | Total | D | R | I | Margin | %Margin | Dem | Rep | Ind | Oth. | Dem | Rep | Ind | Other | | | | | | | | | | | | | | | | | | |
|---|
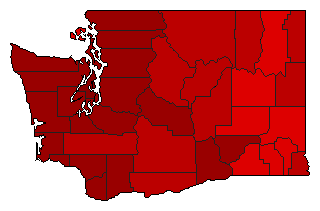
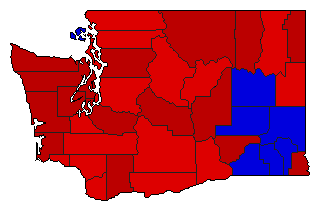
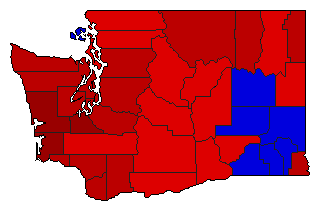
 |  | President |
1,258,556 |
1 |
2 |
0 |
309,515 |
24.59% |
61.97% |
37.37% |
0.00% |
0.66% |
779,881 |
470,366 |
0 |
8,309 |
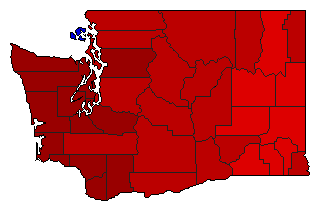
 | | Senator |
1,213,088 |
1 |
2 |
0 |
538,812 |
44.42% |
72.21% |
27.79% |
0.00% |
0.00% |
875,950 |
337,138 |
0 |
0 |
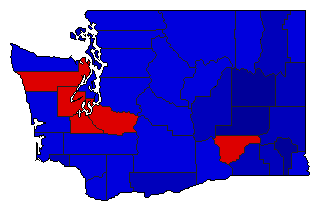 | | Governor |
1,250,274 |
2 |
1 |
0 |
148,564 |
11.88% |
43.89% |
55.77% |
0.00% |
0.35% |
548,692 |
697,256 |
0 |
4,326 |
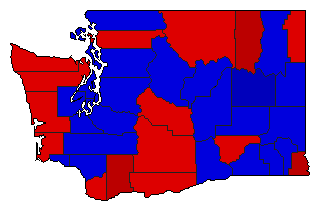
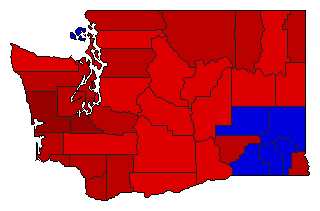
 | | Lt. Governor |
1,190,971 |
1 |
2 |
0 |
139,235 |
11.69% |
55.85% |
44.15% |
0.00% |
0.00% |
665,103 |
525,868 |
0 |
0 |
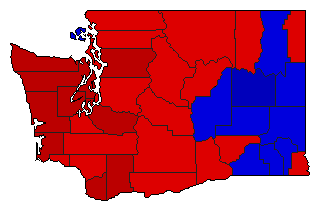
 | | Secretary of State |
1,188,886 |
2 |
1 |
0 |
106,074 |
8.92% |
45.54% |
54.46% |
0.00% |
0.00% |
541,406 |
647,480 |
0 |
0 |
 | | State Treasurer |
1,160,812 |
1 |
2 |
0 |
165,514 |
14.26% |
57.13% |
42.87% |
0.00% |
0.00% |
663,163 |
497,649 |
0 |
0 |
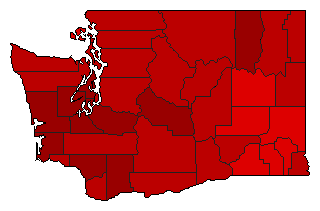
 | | Attorney General |
1,160,680 |
1 |
2 |
0 |
420,704 |
36.25% |
68.12% |
31.88% |
0.00% |
0.00% |
790,692 |
369,988 |
0 |
0 |
 | | Comptroller General |
1,148,012 |
1 |
2 |
0 |
369,194 |
32.16% |
66.08% |
33.92% |
0.00% |
0.00% |
758,603 |
389,409 |
0 |
0 |
 | | State Auditor |
1,133,663 |
1 |
2 |
0 |
206,647 |
18.23% |
59.11% |
40.89% |
0.00% |
0.00% |
670,155 |
463,508 |
0 |
0 |
 | | Insurance Commissioner |
1,110,079 |
1 |
2 |
0 |
238,767 |
21.51% |
60.75% |
39.25% |
0.00% |
0.00% |
674,423 |
435,656 |
0 |
0 |
|
