| Map | Pie | Office | Total | D | R | I | Margin | %Margin | Dem | Rep | Ind | Oth. | Dem | Rep | Ind | Other | | | | | | | | | | | | | | | | | | |
|---|
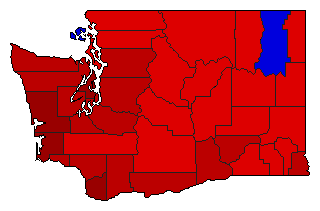
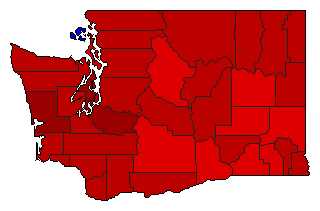
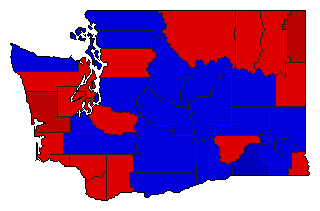
 |  | President |
1,304,281 |
1 |
2 |
3 |
27,527 |
2.11% |
47.23% |
45.12% |
7.44% |
0.21% |
616,037 |
588,510 |
96,990 |
2,744 |
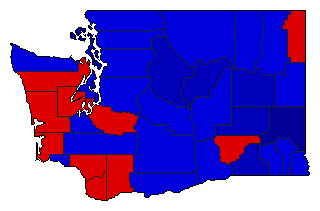
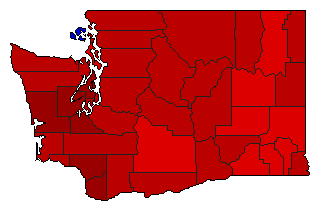
 | | Senator |
1,236,063 |
1 |
2 |
0 |
360,289 |
29.15% |
64.41% |
35.26% |
0.00% |
0.32% |
796,183 |
435,894 |
0 |
3,986 |
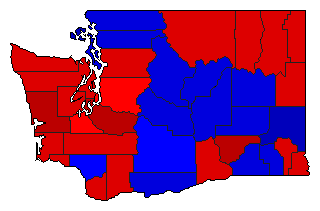
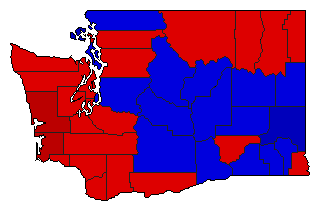
 | | Governor |
1,265,355 |
2 |
1 |
0 |
132,116 |
10.44% |
44.28% |
54.72% |
0.00% |
1.00% |
560,262 |
692,378 |
0 |
12,715 |
 | | Lt. Governor |
1,235,590 |
1 |
2 |
0 |
48,434 |
3.92% |
51.40% |
47.48% |
0.00% |
1.12% |
635,116 |
586,682 |
0 |
13,792 |
 | | Secretary of State |
1,187,187 |
2 |
1 |
0 |
353,191 |
29.75% |
34.61% |
64.36% |
0.00% |
1.03% |
410,901 |
764,092 |
0 |
12,194 |
 | | State Treasurer |
1,179,640 |
1 |
2 |
0 |
325,178 |
27.57% |
63.78% |
36.22% |
0.00% |
0.00% |
752,409 |
427,231 |
0 |
0 |
 | | Attorney General |
1,197,820 |
2 |
1 |
0 |
5,368 |
0.45% |
49.78% |
50.22% |
0.00% |
0.00% |
596,226 |
601,594 |
0 |
0 |
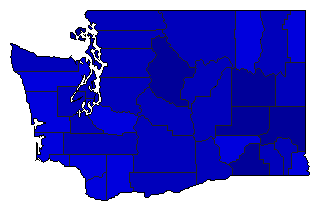
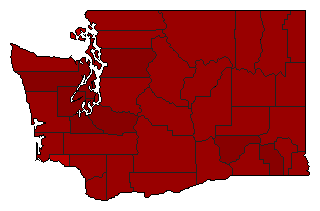 | | Comptroller General |
1,174,442 |
1 |
2 |
0 |
676,208 |
57.58% |
78.79% |
21.21% |
0.00% |
0.00% |
925,325 |
249,117 |
0 |
0 |
 | | State Auditor |
1,141,084 |
1 |
2 |
0 |
362,152 |
31.74% |
65.87% |
34.13% |
0.00% |
0.00% |
751,618 |
389,466 |
0 |
0 |
 | | Insurance Commissioner |
1,135,310 |
1 |
2 |
0 |
16,858 |
1.48% |
50.74% |
49.26% |
0.00% |
0.00% |
576,084 |
559,226 |
0 |
0 |
| | | Map | Pie | Initiative | Total Vote | N | | Y | Margin | %Margin | No | | Yes | Oth. | No | | Yes | |
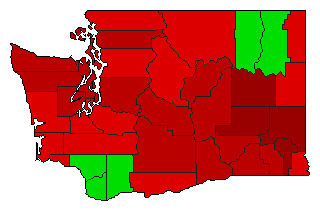 | | Initiative |
1,166,850 |
1 |
0 |
2 |
265,732 |
22.77% |
61.39% |
0.00% |
38.61% |
0.00% |
716,291 |
0 |
450,559 |
0 |
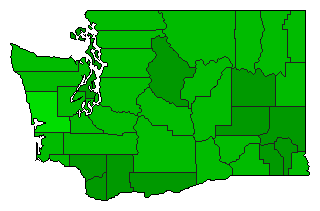 | | Initiative |
1,186,886 |
2 |
0 |
1 |
397,598 |
33.50% |
33.25% |
0.00% |
66.75% |
0.00% |
394,644 |
0 |
792,242 |
0 |
|
