1972 General Election Results Comparison - Oregon
| Map | Pie | Office | Total | D | R | I | Margin | %Margin | Dem | Rep | Ind | Oth. | Dem | Rep | Ind | Other |
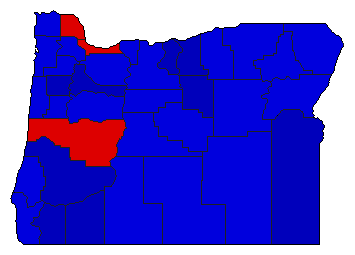
 |  | President | 927,946 | 2 | 1 | - | 93,926 | 10.12% | 42.33% | 52.45% | 0.00% | 5.23% | 392,760 | 486,686 | 0 | 48,500 |
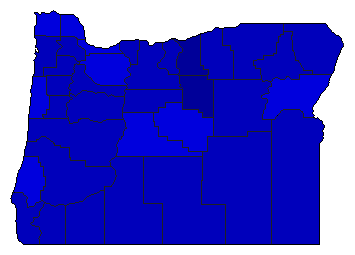
 |  | Senator | 920,833 | 2 | 1 | 0 | 69,635 | 7.56% | 46.16% | 53.72% | 0.00% | 0.12% | 425,036 | 494,671 | 0 | 1,126 |
 |  | Secretary of State | 907,974 | 2 | 1 | 0 | 209,821 | 23.11% | 38.44% | 61.55% | 0.00% | 0.01% | 349,029 | 558,850 | 0 | 95 |
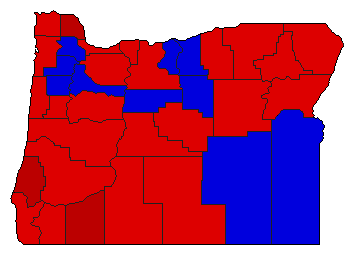 |  | State Treasurer | 878,751 | 1 | 2 | 0 | 93,326 | 10.62% | 55.30% | 44.68% | 0.00% | 0.02% | 485,966 | 392,640 | 0 | 145 |
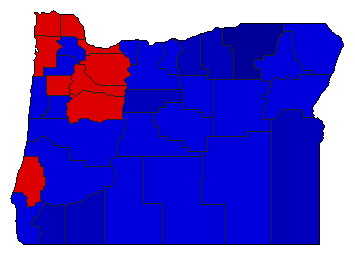 |  | Attorney General | 897,662 | 2 | 1 | 0 | 16,301 | 1.82% | 49.09% | 50.90% | 0.00% | 0.01% | 440,648 | 456,949 | 0 | 65 |
Oregon Results for 1972
Login
© Dave Leip's Atlas of U.S. Elections, LLC 2019 All Rights Reserved
Note: The advertisement links below may advocate political positions that this site does not endorse.
Login
© Dave Leip's Atlas of U.S. Elections, LLC 2019 All Rights Reserved
Note: The advertisement links below may advocate political positions that this site does not endorse.