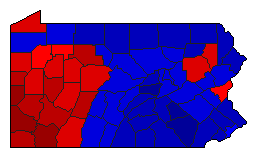
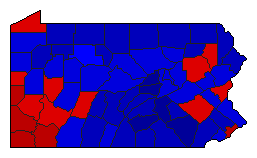
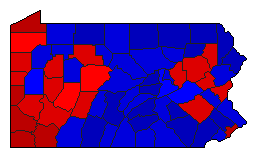
1980 General Election Results Comparison - Pennsylvania
Note: The Google advertisement links below may advocate political positions that this site does not endorse.
MapPieOfficeTotalDRIMargin%MarginDemRepIndOth.DemRepIndOther 
                 
MapMapPresident 4,561,501 2 1 3 324,332 7.11% 42.48% 49.59% 6.42% 1.52% 1,937,540 2,261,872 292,921 69,168
MapSenator 4,418,041 2 1 0 108,013 2.44% 48.04% 50.48% 0.00% 1.48% 2,122,391 2,230,404 0 65,246
MapMapState Treasurer 4,157,578 2 1 0 52,073 1.25% 48.18% 49.43% 0.00% 2.39% 2,003,126 2,055,199 0 99,253
MapMapAttorney General 4,227,150 2 1 0 119,539 2.83% 48.16% 50.99% 0.00% 0.85% 2,035,933 2,155,472 0 35,745
MapMapState Auditor 4,136,452 1 2 0 98,372 2.38% 50.24% 47.86% 0.00% 1.91% 2,077,966 1,979,594 0 78,892

Pennsylvania Results for 1980

Login

Terms of Use - DCMA Policy - Privacy Policy and Cookies


© Dave Leip's Atlas of U.S. Elections, LLC 2019 All Rights Reserved