| Map | Pie | Office | Total | D | R | I | Margin | %Margin | Dem | Rep | Ind | Oth. | Dem | Rep | Ind | Other | | | | | | | | | | | | | | | | | | |
|---|
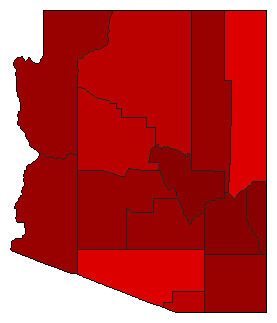
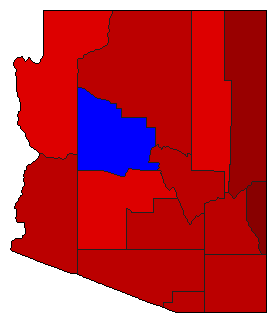 | | Senator |
723,885 |
1 |
2 |
3 |
120,221 |
16.61% |
56.91% |
40.30% |
2.78% |
0.01% |
411,970 |
291,749 |
20,100 |
66 |
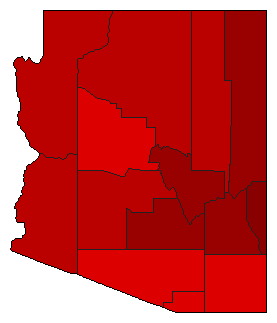
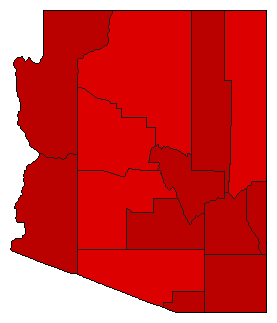
 | | Governor |
726,364 |
1 |
2 |
3 |
217,918 |
30.00% |
62.47% |
32.47% |
5.05% |
0.01% |
453,795 |
235,877 |
36,649 |
43 |
 | | Secretary of State |
691,985 |
1 |
2 |
0 |
182,432 |
26.36% |
61.53% |
35.17% |
0.00% |
3.30% |
425,795 |
243,363 |
0 |
22,827 |
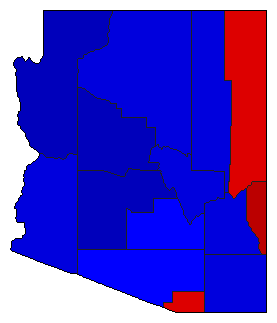
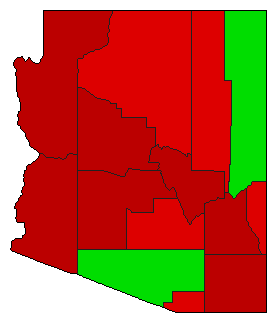
 | | State Treasurer |
656,283 |
2 |
1 |
0 |
13,805 |
2.10% |
48.95% |
51.05% |
0.00% |
0.00% |
321,239 |
335,044 |
0 |
0 |
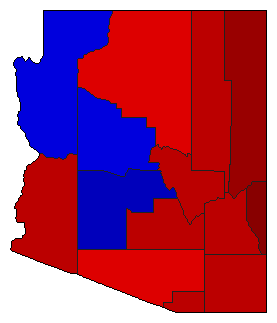
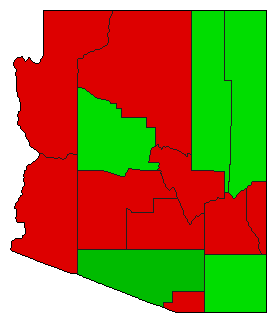
 | | Attorney General |
697,156 |
2 |
1 |
0 |
188,997 |
27.11% |
34.27% |
61.38% |
0.00% |
4.35% |
238,917 |
427,914 |
0 |
30,325 |
| | | Map | Pie | Initiative | Total Vote | N | | Y | Margin | %Margin | No | | Yes | Oth. | No | | Yes | |
 |  | Initiative |
701,681 |
1 |
0 |
2 |
254,031 |
36.20% |
68.10% |
0.00% |
31.90% |
0.00% |
477,856 |
0 |
223,825 |
0 |
 |  | Initiative |
670,608 |
1 |
0 |
2 |
124,316 |
18.54% |
59.27% |
0.00% |
40.73% |
0.00% |
397,462 |
0 |
273,146 |
0 |
 |  | Initiative |
679,544 |
2 |
0 |
1 |
15,574 |
2.29% |
48.85% |
0.00% |
51.15% |
0.00% |
331,985 |
0 |
347,559 |
0 |
 |  | Initiative |
653,575 |
1 |
0 |
2 |
93,005 |
14.23% |
57.12% |
0.00% |
42.88% |
0.00% |
373,290 |
0 |
280,285 |
0 |
|
