| Map | Pie | Year | Total | D | R | I | Margin | %Margin | Dem | Rep | Ind | Oth. | Dem | Rep | Ind | Other | | | | | | | | | | | | | | | | | | |
|---|
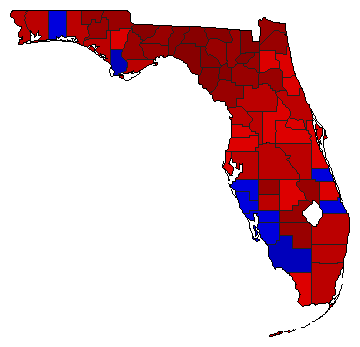
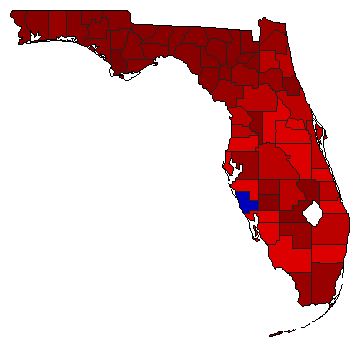
 | | 1998 |
3,779,941 |
2 |
1 |
0 |
802,357 |
21.23% |
39.39% |
60.61% |
0.00% |
0.00% |
1,488,792 |
2,291,149 |
0 |
0 |
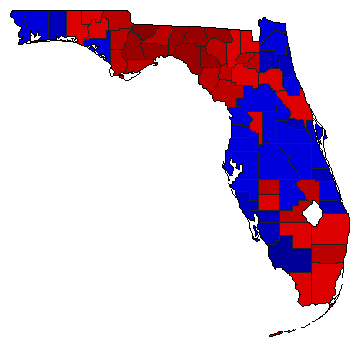 | | 1994 |
3,974,296 |
2 |
1 |
0 |
78,666 |
1.98% |
49.01% |
50.99% |
0.00% |
0.00% |
1,947,815 |
2,026,481 |
0 |
0 |
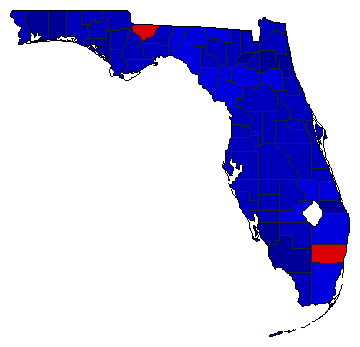
 | | 1990 |
3,357,277 |
1 |
2 |
0 |
641,139 |
19.10% |
59.55% |
40.45% |
0.00% |
0.00% |
1,999,208 |
1,358,069 |
0 |
0 |
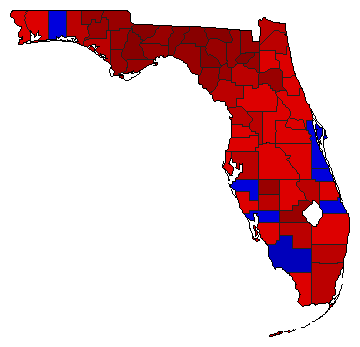
 | | 1986 |
3,176,840 |
1 |
2 |
0 |
668,264 |
21.04% |
60.52% |
39.48% |
0.00% |
0.00% |
1,922,552 |
1,254,288 |
0 |
0 |
 |  | 1970 |
1,540,080 |
1 |
2 |
0 |
487,058 |
31.63% |
65.81% |
34.19% |
0.00% |
0.00% |
1,013,569 |
526,511 |
0 |
0 |
|
