| Map | Pie | Office | Total | D | R | I | Margin | %Margin | Dem | Rep | Ind | Oth. | Dem | Rep | Ind | Other | | | | | | | | | | | | | | | | | | |
|---|
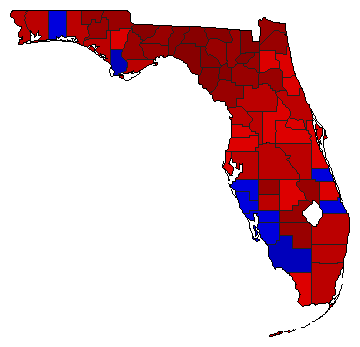
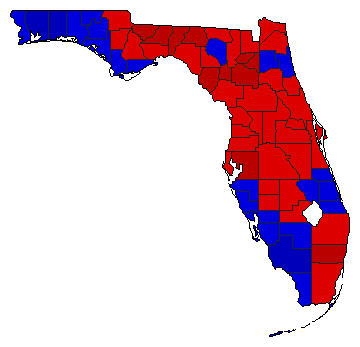 | | Senator |
3,429,996 |
1 |
2 |
0 |
325,167 |
9.48% |
54.74% |
45.26% |
0.00% |
0.00% |
1,877,543 |
1,552,376 |
0 |
77 |
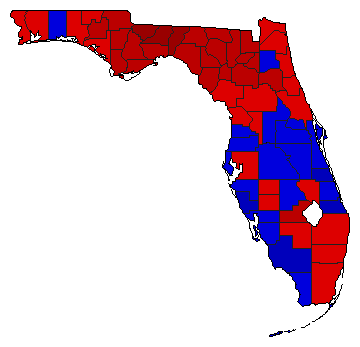
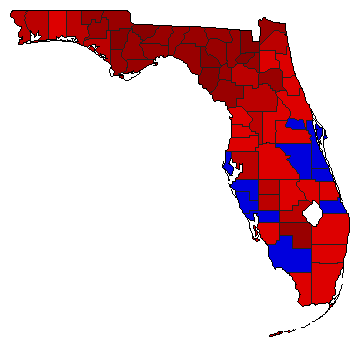
 | | Governor |
3,386,171 |
2 |
1 |
0 |
308,905 |
9.12% |
45.44% |
54.56% |
0.00% |
0.00% |
1,538,620 |
1,847,525 |
0 |
26 |
 | | Secretary of State |
3,272,853 |
1 |
2 |
0 |
132,465 |
4.05% |
52.02% |
47.98% |
0.00% |
0.00% |
1,702,659 |
1,570,194 |
0 |
0 |
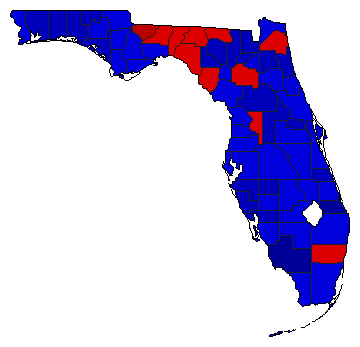
 | | State Treasurer |
3,284,643 |
1 |
2 |
0 |
719,229 |
21.90% |
60.95% |
39.05% |
0.00% |
0.00% |
2,001,936 |
1,282,707 |
0 |
0 |
 | | Attorney General |
3,241,980 |
1 |
2 |
0 |
559,800 |
17.27% |
58.63% |
41.37% |
0.00% |
0.00% |
1,900,890 |
1,341,090 |
0 |
0 |
 | | Comptroller General |
3,176,840 |
1 |
2 |
0 |
668,264 |
21.04% |
60.52% |
39.48% |
0.00% |
0.00% |
1,922,552 |
1,254,288 |
0 |
0 |
 |  | Agriculture Commissioner |
3,217,109 |
1 |
2 |
0 |
377,443 |
11.73% |
55.87% |
44.13% |
0.00% |
0.00% |
1,797,276 |
1,419,833 |
0 |
0 |
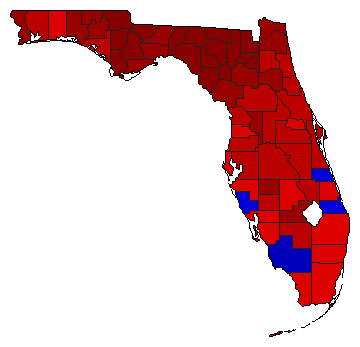
| | | Map | Pie | Initiative | Total Vote | N | | Y | Margin | %Margin | No | | Yes | Oth. | No | | Yes | |
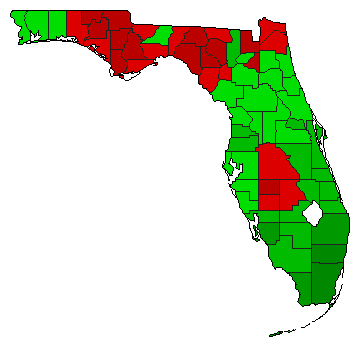 | | Referendum |
3,208,295 |
2 |
0 |
1 |
870,579 |
27.14% |
36.43% |
0.00% |
63.57% |
0.00% |
1,168,858 |
0 |
2,039,437 |
0 |
|
