| Map | Pie | Year | Total | D | R | I | Margin | %Margin | Dem | Rep | Ind | Oth. | Dem | Rep | Ind | Other | | | | | | | | | | | | | | | | | | |
|---|
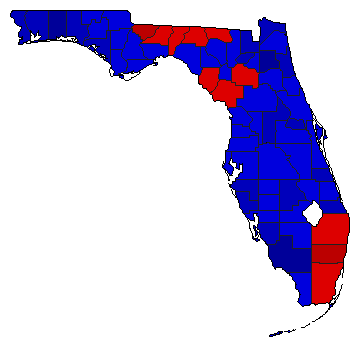 | | 1998 |
3,844,237 |
2 |
1 |
0 |
286,389 |
7.45% |
46.28% |
53.72% |
0.00% |
0.00% |
1,778,924 |
2,065,313 |
0 |
0 |
 | | 1994 |
3,962,895 |
2 |
1 |
0 |
187,519 |
4.73% |
47.63% |
52.37% |
0.00% |
0.00% |
1,887,688 |
2,075,207 |
0 |
0 |
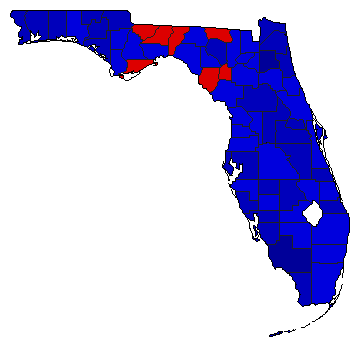 | | 1990 |
3,419,669 |
2 |
1 |
0 |
642,059 |
18.78% |
40.61% |
59.38% |
0.00% |
0.01% |
1,388,600 |
2,030,659 |
0 |
410 |
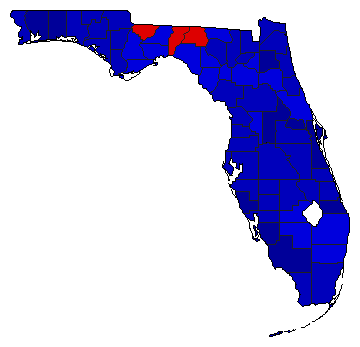 | | 1988 |
4,140,946 |
2 |
1 |
0 |
1,095,288 |
26.45% |
36.77% |
63.22% |
0.00% |
0.01% |
1,522,663 |
2,617,951 |
0 |
332 |
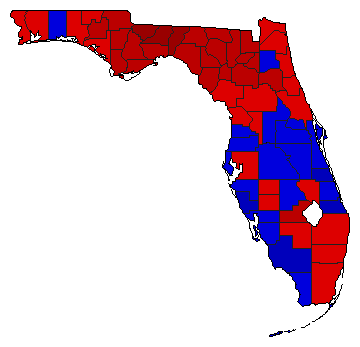 | | 1986 |
3,272,853 |
1 |
2 |
0 |
132,465 |
4.05% |
52.02% |
47.98% |
0.00% |
0.00% |
1,702,659 |
1,570,194 |
0 |
0 |
 | | 1982 |
2,588,869 |
1 |
2 |
0 |
329,299 |
12.72% |
56.36% |
43.64% |
0.00% |
0.00% |
1,459,084 |
1,129,785 |
0 |
0 |
 | | 1978 |
2,324,361 |
1 |
2 |
0 |
232,955 |
10.02% |
55.01% |
44.99% |
0.00% |
0.00% |
1,278,658 |
1,045,703 |
0 |
0 |
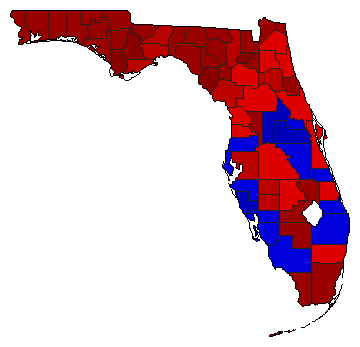 |  | 1970 |
1,526,072 |
1 |
2 |
0 |
201,826 |
13.23% |
56.61% |
43.39% |
0.00% |
0.00% |
863,949 |
662,123 |
0 |
0 |
|