1988 General Election Results Comparison - New Jersey
| Map | Pie | Office | Total | D | R | I | Margin | %Margin | Dem | Rep | Ind | Oth. | Dem | Rep | Ind | Other |
 |  | President | 3,099,553 | 2 | 1 | - | 422,840 | 13.64% | 42.60% | 56.24% | 0.00% | 1.16% | 1,320,352 | 1,743,192 | 0 | 36,009 |
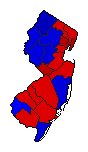 | Senator | 2,987,634 | 1 | 2 | 3 | 249,968 | 8.37% | 53.55% | 45.18% | 0.67% | 0.59% | 1,599,905 | 1,349,937 | 20,091 | 17,701 |
New Jersey Results for 1988
Login
© Dave Leip's Atlas of U.S. Elections, LLC 2019 All Rights Reserved
Note: The advertisement links below may advocate political positions that this site does not endorse.
Login
© Dave Leip's Atlas of U.S. Elections, LLC 2019 All Rights Reserved
Note: The advertisement links below may advocate political positions that this site does not endorse.