| Map | Pie | Year | Total | D | R | I | Margin | %Margin | Dem | Rep | Ind | Oth. | Dem | Rep | Ind | Other | | | | | | | | | | | | | | | | | | |
|---|
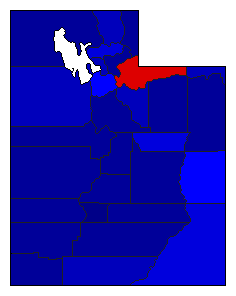
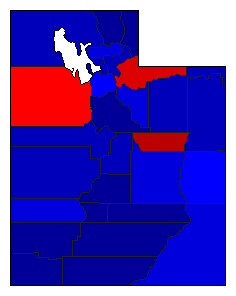
|  | 2022 |
980,213 |
0 |
1 |
0 |
629,311 |
64.20% |
0.00% |
74.11% |
0.00% |
25.89% |
0 |
726,482 |
0 |
253,731 |
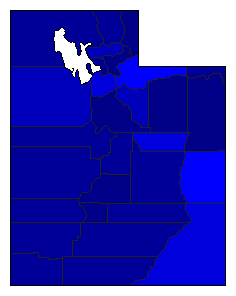
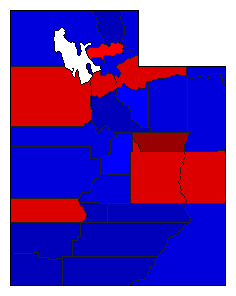
 |  | 2016 |
1,066,087 |
2 |
1 |
3 |
314,728 |
29.52% |
31.70% |
61.23% |
7.07% |
0.00% |
337,997 |
652,725 |
75,365 |
0 |
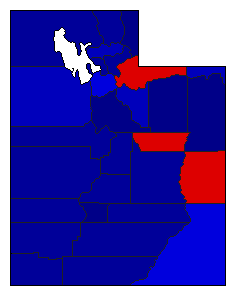
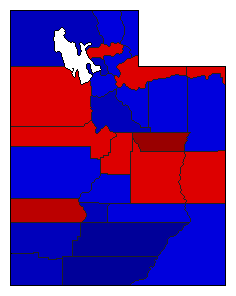
 |  | 2012 |
969,020 |
2 |
1 |
3 |
378,423 |
39.05% |
27.93% |
66.98% |
5.09% |
0.00% |
270,638 |
649,061 |
49,308 |
13 |
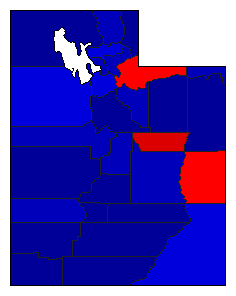
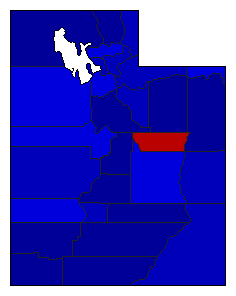
 | | 2008 |
906,338 |
2 |
1 |
0 |
301,844 |
33.30% |
33.35% |
66.65% |
0.00% |
0.00% |
302,247 |
604,091 |
0 |
0 |
 | | 2004 |
863,413 |
2 |
1 |
0 |
244,343 |
28.30% |
33.09% |
61.39% |
0.00% |
5.52% |
285,687 |
530,030 |
0 |
47,696 |
 | | 2000 |
641,847 |
0 |
1 |
0 |
450,675 |
70.22% |
0.00% |
82.94% |
0.00% |
17.06% |
0 |
532,372 |
0 |
109,475 |
 | | 1996 |
644,386 |
2 |
1 |
0 |
118,155 |
18.34% |
39.02% |
57.35% |
0.00% |
3.63% |
251,431 |
369,586 |
0 |
23,369 |
 | | 1992 |
718,690 |
2 |
1 |
3 |
38,134 |
5.31% |
44.08% |
49.39% |
6.53% |
0.00% |
316,798 |
354,932 |
46,960 |
0 |
 | | 1988 |
608,352 |
2 |
1 |
0 |
48,408 |
7.96% |
46.02% |
53.98% |
0.00% |
0.00% |
279,972 |
328,380 |
0 |
0 |
 | | 1984 |
598,845 |
2 |
1 |
0 |
161,959 |
27.05% |
36.48% |
63.52% |
0.00% |
0.00% |
218,443 |
380,402 |
0 |
0 |
 |  | 1940 |
246,184 |
1 |
2 |
0 |
60,006 |
24.37% |
62.19% |
37.81% |
0.00% |
0.00% |
153,095 |
93,089 |
0 |
0 |
 |  | 1924 |
146,565 |
2 |
1 |
0 |
14,389 |
9.82% |
45.09% |
54.91% |
0.00% |
0.00% |
66,088 |
80,477 |
0 |
0 |
|
