| Map | Pie | Office | Total | D | R | I | Margin | %Margin | Dem | Rep | Ind | Oth. | Dem | Rep | Ind | Other | | | | | | | | | | | | | | | | | | |
|---|
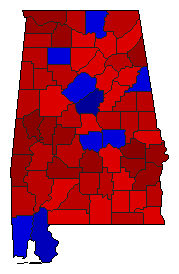
 |  | Senator |
1,185,154 |
1 |
2 |
0 |
250,624 |
21.15% |
60.57% |
39.42% |
0.00% |
0.01% |
717,814 |
467,190 |
0 |
150 |
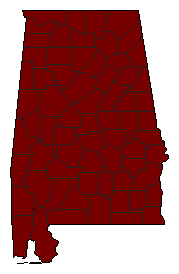
 |  | Governor |
1,215,625 |
2 |
1 |
0 |
51,413 |
4.23% |
47.89% |
52.11% |
0.00% |
0.00% |
582,106 |
633,519 |
0 |
0 |
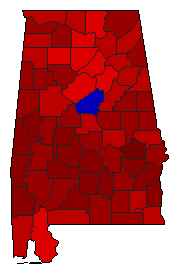
 | | Lt. Governor |
1,142,060 |
1 |
2 |
0 |
395,916 |
34.67% |
67.33% |
32.67% |
0.00% |
0.00% |
768,988 |
373,072 |
0 |
0 |
 | | Secretary of State |
1,103,798 |
1 |
2 |
0 |
115,504 |
10.46% |
55.23% |
44.77% |
0.00% |
0.00% |
609,651 |
494,147 |
0 |
0 |
 |  | State Treasurer |
770,507 |
1 |
0 |
0 |
770,507 |
100.00% |
100.00% |
0.00% |
0.00% |
0.00% |
770,507 |
0 |
0 |
0 |
 | | Attorney General |
1,128,370 |
1 |
2 |
0 |
325,594 |
28.86% |
64.43% |
35.57% |
0.00% |
0.00% |
726,982 |
401,388 |
0 |
0 |
 | | State Auditor |
1,015,808 |
1 |
2 |
0 |
262,048 |
25.80% |
62.90% |
37.10% |
0.00% |
0.00% |
638,928 |
376,880 |
0 |
0 |
 | | Agriculture Commissioner |
1,087,274 |
1 |
2 |
0 |
122,808 |
11.30% |
55.65% |
44.35% |
0.00% |
0.00% |
605,041 |
482,233 |
0 |
0 |
|
