| Map | Pie | Office | Total | D | R | I | Margin | %Margin | Dem | Rep | Ind | Oth. | Dem | Rep | Ind | Other | | | | | | | | | | | | | | | | | | |
|---|
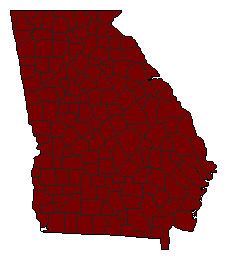
 |  | Senator |
1,033,439 |
1 |
0 |
0 |
1,033,439 |
100.00% |
100.00% |
0.00% |
0.00% |
0.00% |
1,033,439 |
0 |
0 |
0 |
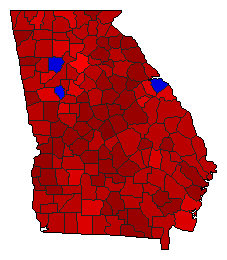
 |  | Governor |
1,449,652 |
1 |
2 |
0 |
121,037 |
8.35% |
52.89% |
44.54% |
0.00% |
2.58% |
766,662 |
645,625 |
0 |
37,365 |
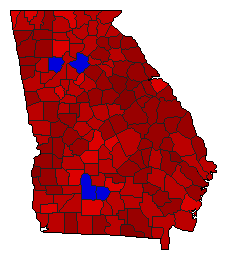
 | | Lt. Governor |
1,379,293 |
1 |
2 |
0 |
390,792 |
28.33% |
62.70% |
34.37% |
0.00% |
2.93% |
864,849 |
474,057 |
0 |
40,387 |
 | | Secretary of State |
1,061,341 |
1 |
0 |
0 |
1,061,341 |
100.00% |
100.00% |
0.00% |
0.00% |
0.00% |
1,061,341 |
0 |
0 |
0 |
 | | Attorney General |
975,745 |
1 |
0 |
0 |
975,745 |
100.00% |
100.00% |
0.00% |
0.00% |
0.00% |
975,745 |
0 |
0 |
0 |
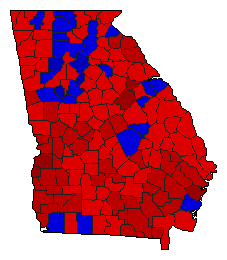 | | Insurance Commissioner |
1,389,222 |
1 |
2 |
0 |
36,250 |
2.61% |
51.30% |
48.70% |
0.00% |
0.00% |
712,736 |
676,486 |
0 |
0 |
 | | Agriculture Commissioner |
1,328,088 |
1 |
2 |
0 |
347,218 |
26.14% |
63.07% |
36.93% |
0.00% |
0.00% |
837,653 |
490,435 |
0 |
0 |
|
