Note: The Google advertisement links below may advocate political positions that this site does not endorse.
| Map | Pie | Office | Total | D | R | I | Margin | %Margin | Dem | Rep | Ind | Oth. | Dem | Rep | Ind | Other | | | | | | | | | | | | | | | | | | |
|---|
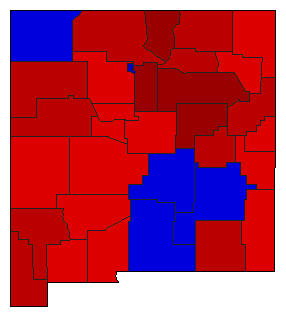
 |  | Senator |
406,938 |
2 |
1 |
0 |
186,679 |
45.87% |
27.04% |
72.91% |
0.00% |
0.05% |
110,033 |
296,712 |
0 |
193 |
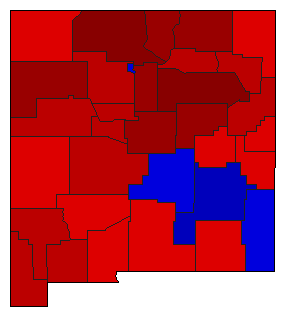
 |  | Governor |
411,236 |
1 |
2 |
0 |
38,872 |
9.45% |
54.61% |
45.15% |
0.00% |
0.24% |
224,564 |
185,692 |
0 |
980 |
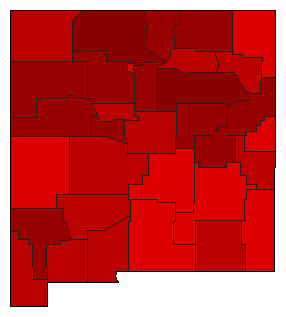
 |  | Secretary of State |
379,899 |
1 |
2 |
3 |
57,283 |
15.08% |
57.51% |
42.44% |
0.05% |
0.00% |
218,495 |
161,212 |
192 |
0 |
 | | State Treasurer |
387,934 |
1 |
2 |
0 |
93,160 |
24.01% |
62.01% |
37.99% |
0.00% |
0.00% |
240,547 |
147,387 |
0 |
0 |
 |  | Attorney General |
392,946 |
1 |
2 |
0 |
138,218 |
35.17% |
67.59% |
32.41% |
0.00% |
0.00% |
265,582 |
127,364 |
0 |
0 |
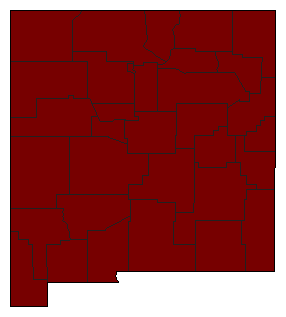 | | State Auditor |
259,473 |
1 |
0 |
0 |
259,473 |
100.00% |
100.00% |
0.00% |
0.00% |
0.00% |
259,473 |
0 |
0 |
0 |
|
