| Map | Pie | Year | Total | D | R | I | Margin | %Margin | Dem | Rep | Ind | Oth. | Dem | Rep | Ind | Other | | | | | | | | | | | | | | | | | | |
|---|
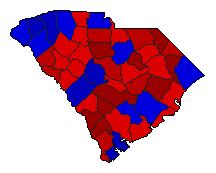
|  | 2022 |
1,418,286 |
0 |
1 |
0 |
848,266 |
59.81% |
0.00% |
79.67% |
0.00% |
20.33% |
0 |
1,129,961 |
0 |
288,325 |
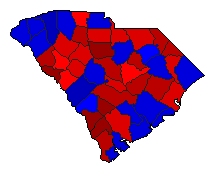
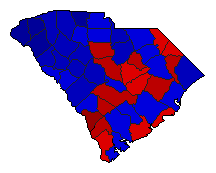 |  | 2018 |
1,701,900 |
2 |
1 |
0 |
229,256 |
13.47% |
42.48% |
55.95% |
0.00% |
1.57% |
722,977 |
952,233 |
0 |
26,690 |
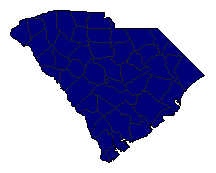
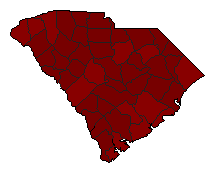
 | | 2014 |
868,345 |
0 |
1 |
0 |
846,707 |
97.51% |
0.00% |
98.75% |
0.00% |
1.25% |
0 |
857,526 |
0 |
10,819 |
 | | 2010 |
917,503 |
0 |
1 |
0 |
898,007 |
97.88% |
0.00% |
98.94% |
0.00% |
1.06% |
0 |
907,755 |
0 |
9,748 |
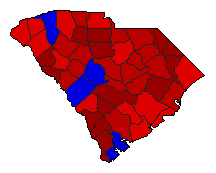
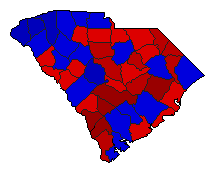 | | 2006 |
1,085,924 |
2 |
1 |
0 |
47,574 |
4.38% |
47.79% |
52.17% |
0.00% |
0.04% |
518,966 |
566,540 |
0 |
418 |
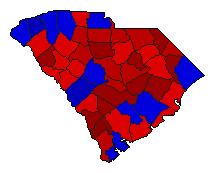 | | 2002 |
1,078,794 |
1 |
2 |
0 |
48,426 |
4.49% |
52.23% |
47.74% |
0.00% |
0.02% |
563,478 |
515,052 |
0 |
264 |
 | | 1998 |
1,046,813 |
1 |
2 |
0 |
6,784 |
0.65% |
50.30% |
49.65% |
0.00% |
0.05% |
526,538 |
519,754 |
0 |
521 |
 | | 1994 |
894,632 |
2 |
1 |
0 |
18,681 |
2.09% |
47.53% |
49.62% |
0.00% |
2.84% |
425,251 |
443,932 |
0 |
25,449 |
 | | 1990 |
734,931 |
1 |
2 |
0 |
104,712 |
14.25% |
57.11% |
42.86% |
0.00% |
0.04% |
419,687 |
314,975 |
0 |
269 |
 | | 1986 |
583,827 |
1 |
0 |
0 |
504,431 |
86.40% |
90.45% |
0.00% |
0.00% |
9.55% |
528,065 |
0 |
0 |
55,762 |
|
