Note: The Google advertisement links below may advocate political positions that this site does not endorse.
| Map | Pie | Year | Total | D | R | I | Margin | %Margin | Dem | Rep | Ind | Oth. | Dem | Rep | Ind | Other | | | | | | | | | | | | | | | | | | |
|---|
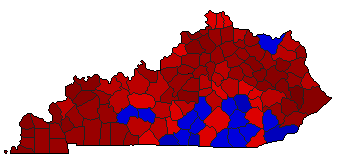 | | 1991 |
764,880 |
1 |
2 |
0 |
263,166 |
34.41% |
67.20% |
32.80% |
0.00% |
0.00% |
514,023 |
250,857 |
0 |
0 |
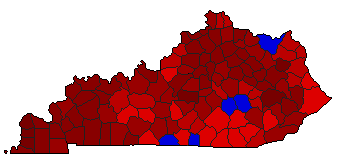 | | 1987 |
704,446 |
1 |
2 |
0 |
331,490 |
47.06% |
73.51% |
26.45% |
0.00% |
0.04% |
517,811 |
186,321 |
0 |
314 |
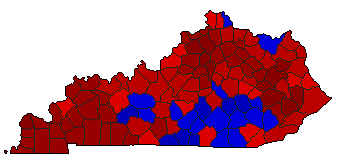 | | 1983 |
897,949 |
1 |
2 |
0 |
247,517 |
27.56% |
63.35% |
35.79% |
0.00% |
0.86% |
568,869 |
321,352 |
0 |
7,728 |
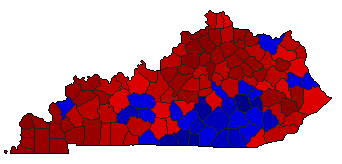 | | 1979 |
859,894 |
1 |
2 |
0 |
226,458 |
26.34% |
63.17% |
36.83% |
0.00% |
0.00% |
543,176 |
316,718 |
0 |
0 |
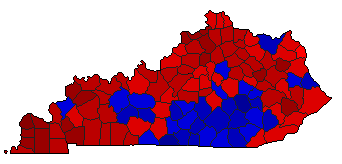 |  | 1971 |
863,259 |
1 |
2 |
0 |
105,017 |
12.17% |
55.66% |
43.50% |
0.00% |
0.84% |
480,525 |
375,508 |
0 |
7,226 |
|