| Map | Pie | Office | Total | D | R | I | Margin | %Margin | Dem | Rep | Ind | Oth. | Dem | Rep | Ind | Other | | | | | | | | | | | | | | | | | | |
|---|
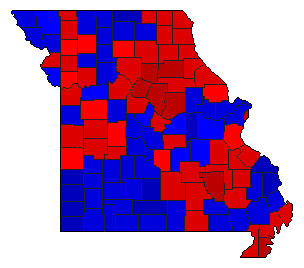
 |  | President |
2,391,565 |
1 |
2 |
3 |
242,714 |
10.15% |
44.07% |
33.92% |
21.69% |
0.33% |
1,053,873 |
811,159 |
518,741 |
7,792 |
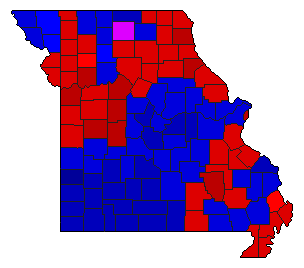
 |  | Senator |
2,354,916 |
2 |
1 |
0 |
163,934 |
6.96% |
44.93% |
51.89% |
0.00% |
3.19% |
1,057,967 |
1,221,901 |
0 |
75,048 |
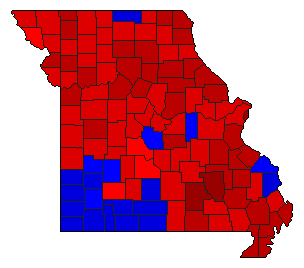
 |  | Governor |
2,343,999 |
1 |
2 |
0 |
406,851 |
17.36% |
58.68% |
41.32% |
0.00% |
0.00% |
1,375,425 |
968,574 |
0 |
0 |
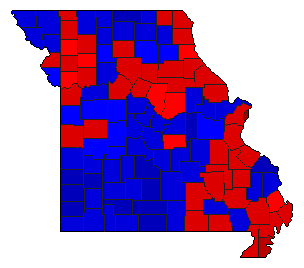
 | | Lt. Governor |
2,325,982 |
1 |
2 |
0 |
37,052 |
1.59% |
49.50% |
47.91% |
0.00% |
2.59% |
1,151,357 |
1,114,305 |
0 |
60,320 |
 | | Secretary of State |
2,307,478 |
1 |
2 |
0 |
32,723 |
1.42% |
49.42% |
48.00% |
0.00% |
2.57% |
1,140,424 |
1,107,701 |
0 |
59,353 |
 | | State Treasurer |
2,274,048 |
1 |
2 |
0 |
438,610 |
19.29% |
56.54% |
37.26% |
0.00% |
6.20% |
1,285,845 |
847,235 |
0 |
140,968 |
 | | Attorney General |
2,312,104 |
1 |
2 |
0 |
89,900 |
3.89% |
49.94% |
46.05% |
0.00% |
4.00% |
1,154,714 |
1,064,814 |
0 |
92,576 |
|
