| Map | Pie | Year | Total | D | R | I | Margin | %Margin | Dem | Rep | Ind | Oth. | Dem | Rep | Ind | Other | | | | | | | | | | | | | | | | | | |
|---|
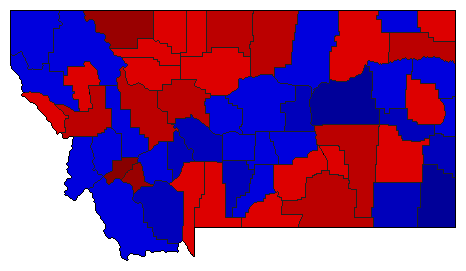
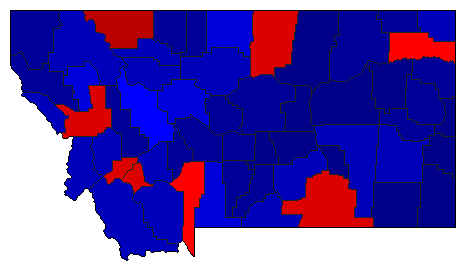 |  | 2020 |
590,643 |
2 |
1 |
0 |
94,108 |
15.93% |
39.39% |
55.32% |
0.00% |
5.29% |
232,634 |
326,742 |
0 |
31,267 |
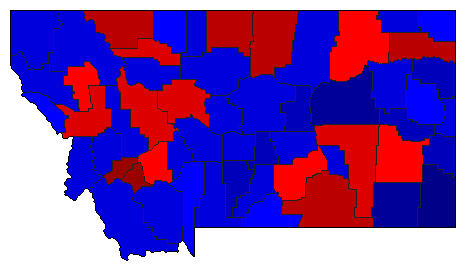
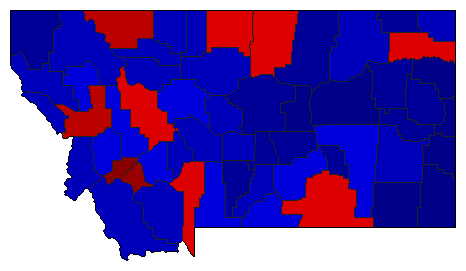 |  | 2016 |
486,970 |
2 |
1 |
0 |
37,120 |
7.62% |
46.19% |
53.81% |
0.00% |
0.00% |
224,925 |
262,045 |
0 |
0 |
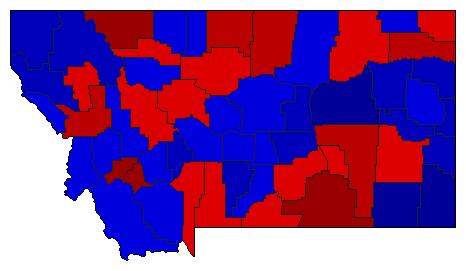 | | 2012 |
459,814 |
1 |
2 |
0 |
31,792 |
6.91% |
53.46% |
46.54% |
0.00% |
0.00% |
245,803 |
214,011 |
0 |
0 |
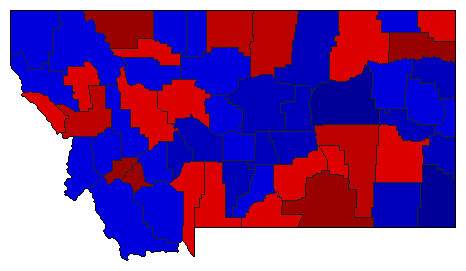 | | 2008 |
458,294 |
1 |
2 |
0 |
31,326 |
6.84% |
53.42% |
46.58% |
0.00% |
0.00% |
244,810 |
213,484 |
0 |
0 |
 | | 2004 |
426,725 |
1 |
2 |
0 |
50,109 |
11.74% |
55.87% |
44.13% |
0.00% |
0.00% |
238,417 |
188,308 |
0 |
0 |
 | | 2000 |
391,192 |
1 |
2 |
0 |
21,433 |
5.48% |
50.18% |
44.70% |
0.00% |
5.13% |
196,287 |
174,854 |
0 |
20,051 |
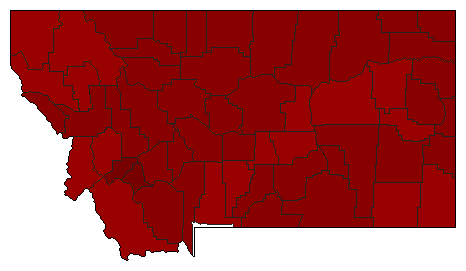 | | 1996 |
368,688 |
1 |
0 |
0 |
242,434 |
65.76% |
82.88% |
0.00% |
0.00% |
17.12% |
305,561 |
0 |
0 |
63,127 |
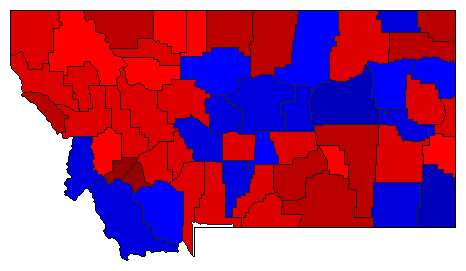 | | 1992 |
392,852 |
1 |
2 |
0 |
61,564 |
15.67% |
55.80% |
40.13% |
0.00% |
4.07% |
219,209 |
157,645 |
0 |
15,998 |
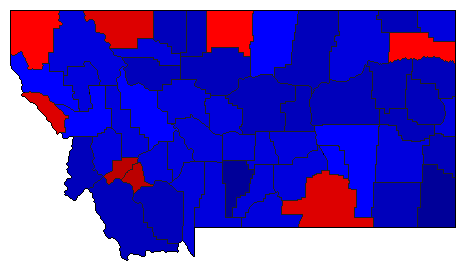 |  | 1984 |
360,081 |
2 |
1 |
0 |
44,132 |
12.26% |
40.94% |
53.19% |
0.00% |
5.87% |
147,403 |
191,535 |
0 |
21,143 |
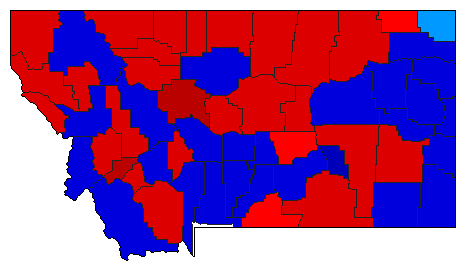 |  | 1932 |
194,282 |
1 |
2 |
3 |
7,457 |
3.84% |
51.05% |
47.21% |
1.00% |
0.75% |
99,175 |
91,718 |
1,937 |
1,452 |
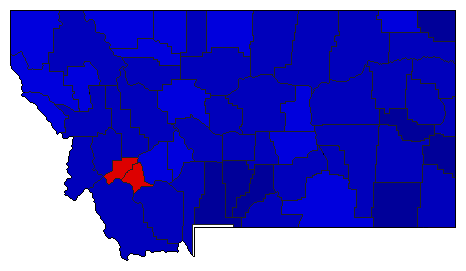 |  | 1928 |
174,983 |
2 |
1 |
3 |
39,446 |
22.54% |
38.49% |
61.03% |
0.47% |
0.00% |
67,353 |
106,799 |
831 |
0 |
|