| Map | Pie | Office | Total | D | R | I | Margin | %Margin | Dem | Rep | Ind | Oth. | Dem | Rep | Ind | Other | | | | | | | | | | | | | | | | | | |
|---|
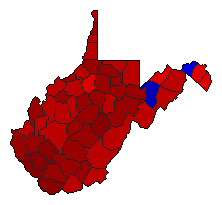
 |  | President |
683,711 |
1 |
2 |
3 |
89,027 |
13.02% |
48.41% |
35.39% |
15.92% |
0.28% |
331,001 |
241,974 |
108,829 |
1,907 |
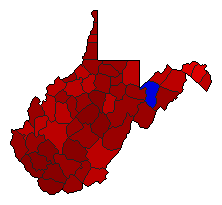
 |  | Governor |
657,565 |
1 |
2 |
0 |
127,912 |
19.45% |
56.01% |
36.56% |
0.00% |
7.43% |
368,302 |
240,390 |
0 |
48,873 |
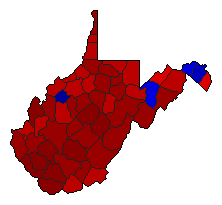
 |  | Secretary of State |
600,096 |
1 |
2 |
0 |
235,690 |
39.28% |
69.64% |
30.36% |
0.00% |
0.00% |
417,893 |
182,203 |
0 |
0 |
 | | State Treasurer |
572,069 |
1 |
2 |
0 |
252,125 |
44.07% |
72.04% |
27.96% |
0.00% |
0.00% |
412,097 |
159,972 |
0 |
0 |
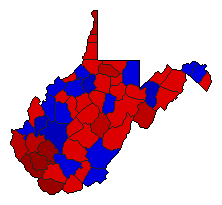 | | Attorney General |
596,465 |
1 |
2 |
0 |
18,735 |
3.14% |
51.57% |
48.43% |
0.00% |
0.00% |
307,600 |
288,865 |
0 |
0 |
 | | Agriculture Commissioner |
585,929 |
1 |
2 |
0 |
241,809 |
41.27% |
70.63% |
29.37% |
0.00% |
0.00% |
413,869 |
172,060 |
0 |
0 |
|
