| Map | Pie | Year | Total | D | R | I | Margin | %Margin | Dem | Rep | Ind | Oth. | Dem | Rep | Ind | Other | | | | | | | | | | | | | | | | | | |
|---|
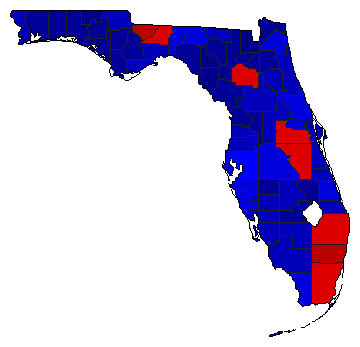
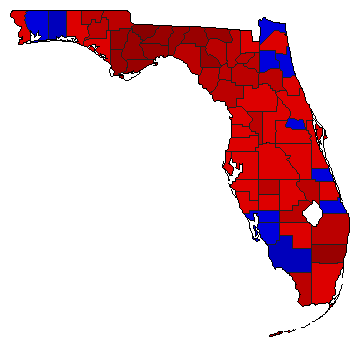
|  | 2022 |
7,677,335 |
2 |
1 |
0 |
1,625,417 |
21.17% |
39.41% |
60.59% |
0.00% |
0.00% |
3,025,959 |
4,651,376 |
0 |
0 |
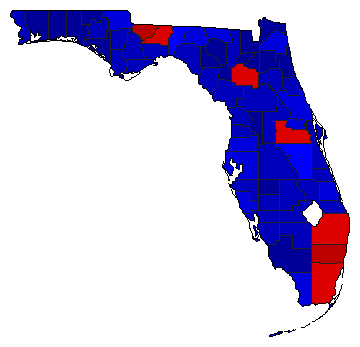
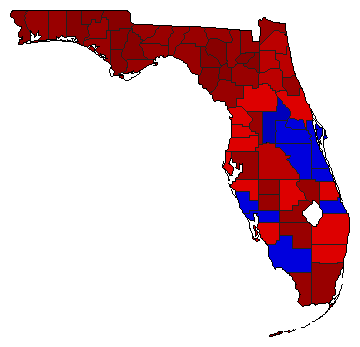
 |  | 2018 |
8,122,740 |
2 |
1 |
3 |
487,620 |
6.00% |
46.10% |
52.11% |
1.79% |
0.00% |
3,744,912 |
4,232,532 |
145,296 |
0 |
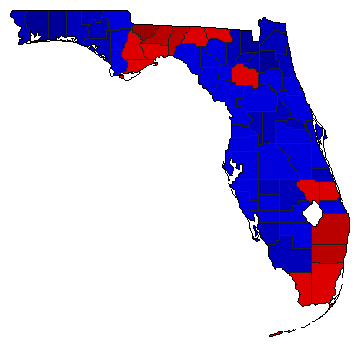
 | | 2014 |
5,849,235 |
2 |
1 |
3 |
765,207 |
13.08% |
42.01% |
55.09% |
2.90% |
0.00% |
2,457,317 |
3,222,524 |
169,394 |
0 |
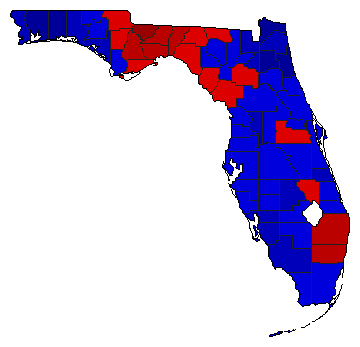
 | | 2010 |
5,263,392 |
2 |
1 |
3 |
701,491 |
13.33% |
41.44% |
54.77% |
3.78% |
0.00% |
2,181,377 |
2,882,868 |
199,147 |
0 |
 | | 2006 |
4,645,967 |
2 |
1 |
0 |
250,049 |
5.38% |
47.31% |
52.69% |
0.00% |
0.00% |
2,197,959 |
2,448,008 |
0 |
0 |
 | | 2002 |
4,935,765 |
2 |
1 |
0 |
337,467 |
6.84% |
46.58% |
53.42% |
0.00% |
0.00% |
2,299,149 |
2,636,616 |
0 |
0 |
 | | 1998 |
3,863,597 |
1 |
2 |
0 |
739,059 |
19.13% |
59.56% |
40.44% |
0.00% |
0.00% |
2,301,328 |
1,562,269 |
0 |
0 |
 | | 1994 |
4,021,149 |
1 |
2 |
0 |
602,871 |
14.99% |
57.50% |
42.50% |
0.00% |
0.00% |
2,312,010 |
1,709,139 |
0 |
0 |
 | | 1986 |
3,241,980 |
1 |
2 |
0 |
559,800 |
17.27% |
58.63% |
41.37% |
0.00% |
0.00% |
1,900,890 |
1,341,090 |
0 |
0 |
 |  | 1970 |
1,536,295 |
1 |
2 |
0 |
351,257 |
22.86% |
61.43% |
38.57% |
0.00% |
0.00% |
943,776 |
592,519 |
0 |
0 |
|
