| Map | Pie | Office | Total | D | R | I | Margin | %Margin | Dem | Rep | Ind | Oth. | Dem | Rep | Ind | Other | | | | | | | | | | | | | | | | | | |
|---|
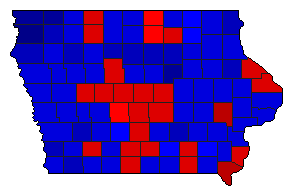
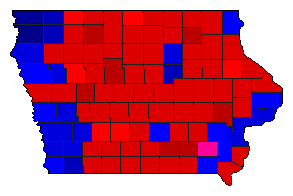
 |  | Governor |
997,248 |
2 |
1 |
3 |
151,942 |
15.24% |
41.56% |
56.80% |
0.55% |
1.09% |
414,453 |
566,395 |
5,505 |
10,895 |
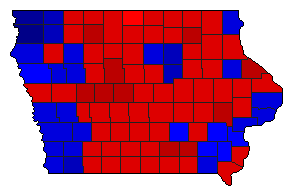
 | | Secretary of State |
918,162 |
2 |
1 |
0 |
44,745 |
4.87% |
46.68% |
51.56% |
0.00% |
1.76% |
428,626 |
473,371 |
0 |
16,165 |
 | | State Treasurer |
926,149 |
1 |
2 |
0 |
91,367 |
9.87% |
53.56% |
43.70% |
0.00% |
2.74% |
496,089 |
404,722 |
0 |
25,338 |
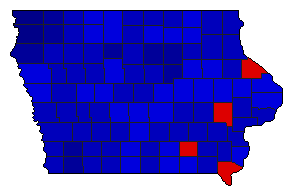
 | | Attorney General |
954,823 |
1 |
2 |
0 |
77,048 |
8.07% |
53.31% |
45.24% |
0.00% |
1.44% |
509,045 |
431,997 |
0 |
13,781 |
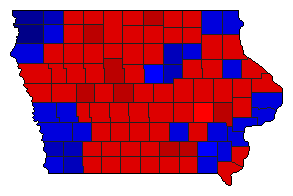
 | | State Auditor |
910,149 |
2 |
1 |
0 |
174,210 |
19.14% |
40.40% |
59.54% |
0.00% |
0.05% |
367,722 |
541,932 |
0 |
495 |
 |  | Agriculture Commissioner |
933,466 |
1 |
2 |
0 |
91,649 |
9.82% |
52.64% |
42.82% |
0.00% |
4.55% |
491,342 |
399,693 |
0 |
42,431 |
|
