| Map | Pie | Office | Total | D | R | I | Margin | %Margin | Dem | Rep | Ind | Oth. | Dem | Rep | Ind | Other | | | | | | | | | | | | | | | | | | |
|---|
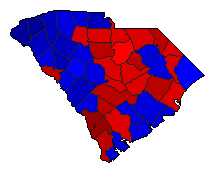
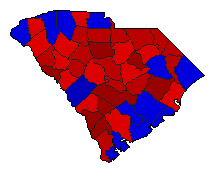
 |  | Governor |
933,850 |
2 |
1 |
3 |
23,754 |
2.54% |
47.87% |
50.41% |
0.86% |
0.87% |
447,002 |
470,756 |
8,003 |
8,089 |
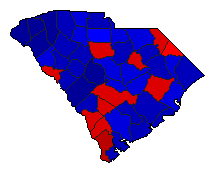
 | | Lt. Governor |
915,852 |
2 |
1 |
0 |
73,389 |
8.01% |
45.43% |
53.44% |
0.00% |
1.14% |
416,030 |
489,419 |
0 |
10,403 |
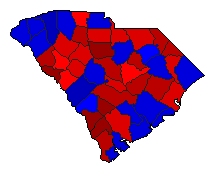
 | | Secretary of State |
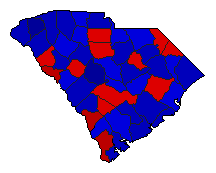
893,591 |
2 |
1 |
0 |
247,138 |
27.66% |
34.98% |
62.63% |
0.00% |
2.39% |
312,549 |
559,687 |
0 |
21,355 |
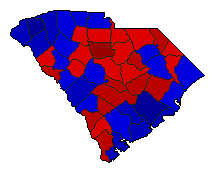
 | | State Treasurer |
894,632 |
2 |
1 |
0 |
18,681 |
2.09% |
47.53% |
49.62% |
0.00% |
2.84% |
425,251 |
443,932 |
0 |
25,449 |
 | | Attorney General |
907,490 |
2 |
1 |
0 |
94,805 |
10.45% |
44.76% |
55.21% |
0.00% |
0.03% |
406,184 |
500,989 |
0 |
317 |
 | | Comptroller General |
879,927 |
1 |
2 |
0 |
55,141 |
6.27% |
53.12% |
46.85% |
0.00% |
0.03% |
467,399 |
412,258 |
0 |
270 |
 |  | Agriculture Commissioner |
885,496 |
2 |
1 |
0 |
208,081 |
23.50% |
38.24% |
61.74% |
0.00% |
0.03% |
338,589 |
546,670 |
0 |
237 |
|
